OTC Maps: Regional market analysis in the Insights Hub
26.02.2026
With OTC Maps, we introduce a new perspective to the Insights Hub: regional market analysis. Data that was previously only available via Custom Download can now be directly visualized and analyzed within the platform. Regional differences and developments become visible at a glance – without the need for exports or manual data preparation. (see image)
1. Access & interface
- Dashboard access
2. Regional coverage
- Analysis at federal state level
- Planned extension: 2-digit postal code level
3. KPIs & metrics
- Sales volume
- Revenue (APU, rAVP)
- Potential customers
- Active customers
- Growth rates
4. Time logic
- Cumulative & rolling
- Time periods: LM, L3M, YTD, MAT
5. Data history & output
- Historical data: up to 12 months
- Export: LM
Regional performance at a glance
OTC Maps enables the regional analysis of performance for products, product groups, brands, and companies across Germany. At launch, analyses are available at federal state level, with an extension to 2-digit postal code level planned.
All established KPIs in the Insights Hub can be analyzed per region – both cumulative and rolling (LM, L3M, YTD, MAT) – over a period of up to 12 months, including growth values. This makes regional developments transparent and allows for direct comparison with the overall market.
In addition, regional metrics such as orders per capita, potential and active customers, and online order volume are provided. Combined with market share and growth rates, this creates a solid foundation for evaluating regional differences – for example, when comparing individual states such as NRW with the overall German market.
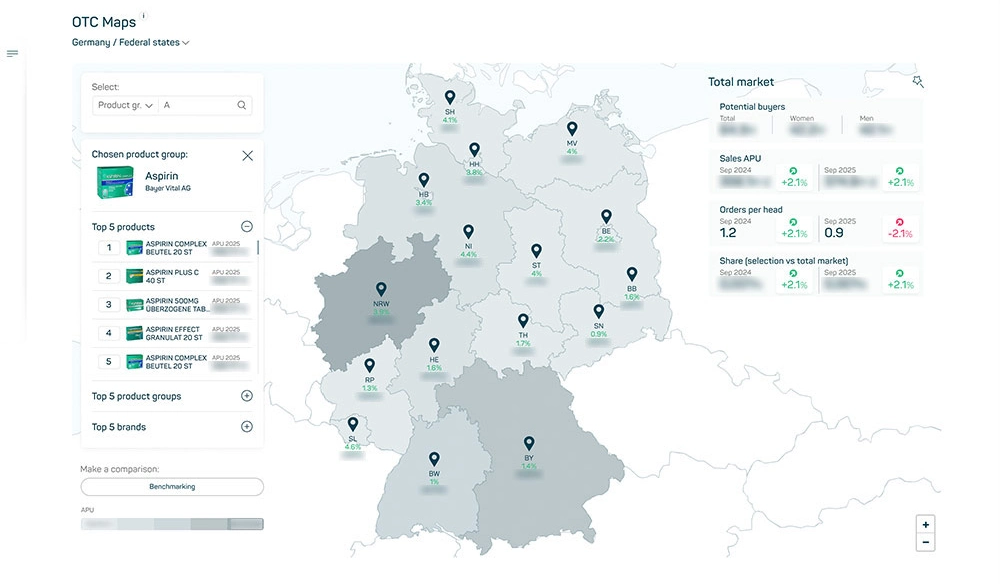
Image 1