Key Account Insights: Performance data in the Insights Hub
09.03.2026
Key Account Insights (KAI) provides a standardized and structured access to sales and stock data of individual online pharmacies – directly from the point of sale. This makes the performance of your products at specific retail partner level transparent, comparable, and actionable.
Data is centrally prepared and standardized for your company and can be seamlessly integrated into existing analyses. By linking it with total market and ATC structures, sales data is no longer viewed in isolation but consistently placed in its market context – by shop, portfolio, and category.
This allows you to clearly assess which products perform at which key accounts, where availability or stock issues impact revenue, and how shop performance compares to the overall market.
Key Account Insights adds a new perspective to the Insights Hub and expands your analytical foundation for sales, marketing, and category management. (see image)
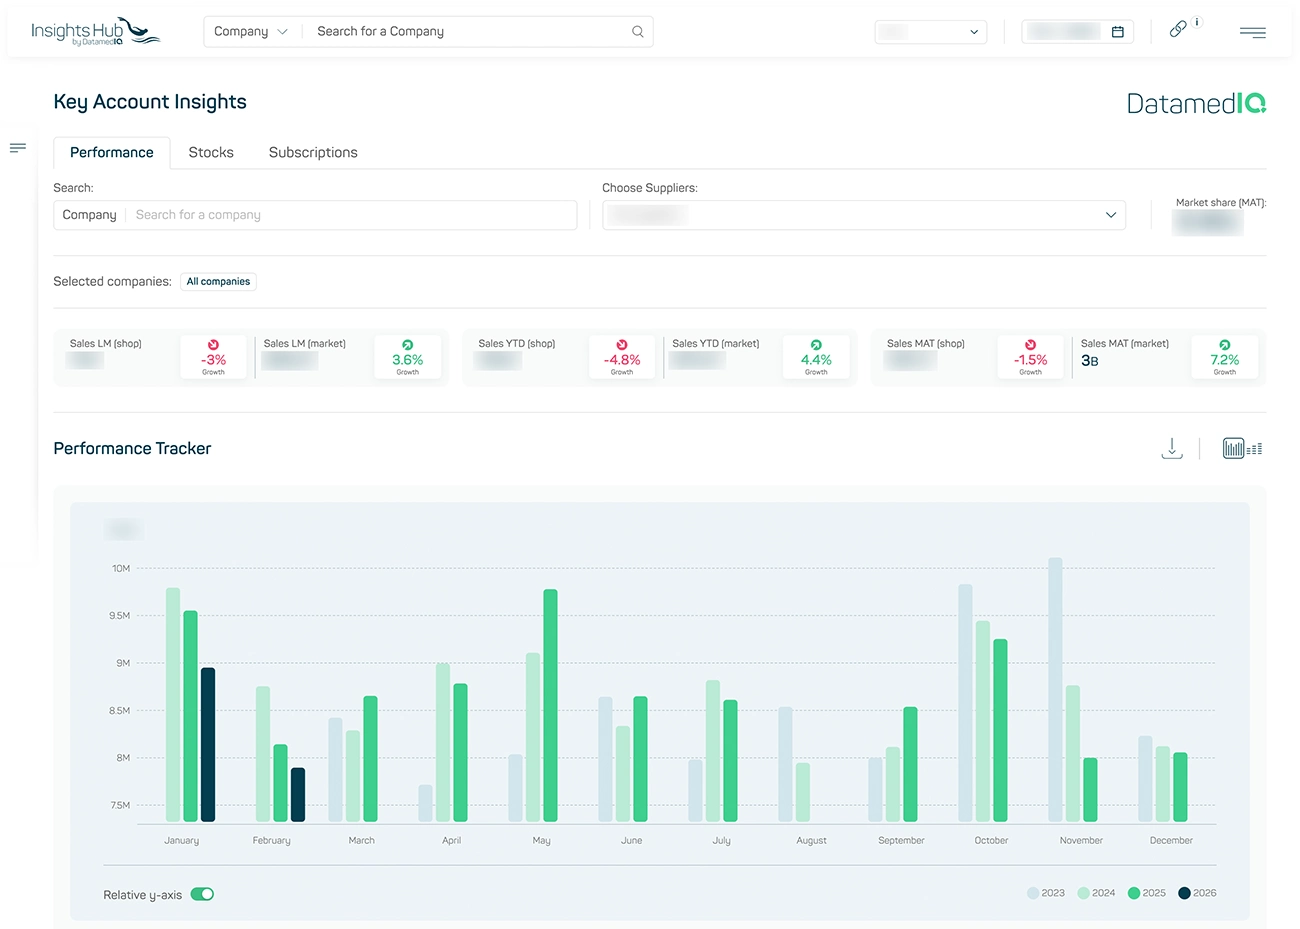
Image 1
Current scope
1) Access & usage model
- Role-based access (manufacturers, online retailers)
- Package logic (Base / Advanced / Premium)
- Subscription management
2) Analysis & control
- KPIs: sales volume, revenue (APU), stock, growth rates
- Time logic: LM, L3M, YTD, MAT (cumulative & rolling)
- Benchmarking: portfolio vs. market / shop
- Categories & market definitions based on ATC-3
3) Data & output
- Historical data: up to 36 months
- Exports: CSV, XLS
Performance: Analyze sales in market context
Within the Performance module, Key Account Insights shows the sales development of your products over time, including market share, growth, and comparison to the total market. This provides a solid foundation to not only observe changes but to understand them in context. (see image)
You can identify not just that something is changing, but why – whether developments are shop-specific or part of a broader market trend.
1. Performance by online pharmacy
You can track how your products perform across individual online pharmacies over freely selectable time periods. This allows you to identify early:
- where products perform particularly well or poorly
- where market share is gained or lost
- which segments are driving growth
Integration with market and ATC references ensures a valid classification instead of isolated analysis.
2. Portfolio view
The Portfolio View extends this perspective to brand and product level. Here, you can benchmark your performance against different references:
- the projected DatamedIQ panel value of the same brand or product
- an ATC-3 category within the selected shops
- the corresponding ATC-3 category on total market level
This provides a differentiated view across both shop and market perspectives.
3. Development over the last 12 months
The L12M mode offers a structured view of the last twelve months, including:
- Current MAT
- Previous MAT
- YOY growth
- aggregated totals
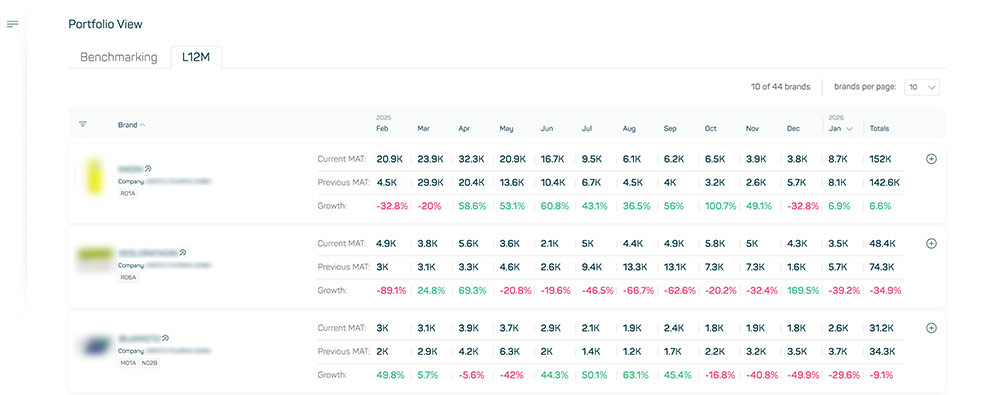
Image 2
This allows you to track developments over a full year and directly compare current performance with the previous year.
By combining time-based analysis, market comparison, and portfolio insights, individual performance data is transformed into a clear basis for both operational decisions and strategic discussions.