Executive Summary – Search Visibility
23.06.2026
The latest product iteration introduces the first Executive Summary in POS Insights, starting with the Search Visibility submodule.
It brings together the key search visibility metrics in one place, from the overall portfolio down to individual brands and product groups. The result is a clear picture of search visibility across the shops at a glance: where listings rank well, how a portfolio compares to competitors, and where there is concrete keyword potential. All figures are based on the most recently completed calendar week.

Image 1
Entry point: company level across all shops
When first opened, the Executive Summary shows the company level, where every value covers the entire product portfolio across all shops. Five tiles answer the central question, „How visible is my portfolio across all shops?“ (see image 1):
| My brands | The number of brands; expandable as the entry point to the brand table. |
| Top 10 listings | Brands ranking in the top 10 for at least one search term, with at least one product. |
| Listed in pharmacies | The pharmacies the company is listed in; expandable to a green or red traffic light per pharmacy. |
| Listed in search terms | The search terms the company is listed in, with the week-on-week trend; expandable to each term and its rank. |
| Avg. listing position | The average listing position across the portfolio, with the week-on-week trend. |
One level deeper: brand level across all shops
Clicking the first tile opens a table of all brands, sorted in descending order by Sales rAVP MAT. Each brand’s values are shown across all shops (see image 2). The table is structured as follows:
| Rank | The brand’s position by Sales rAVP MAT; the higher the value, the better the rank. |
| Pharmacies | The pharmacies the brand is listed in with at least one product; expandable to a green or red traffic light per pharmacy. |
| All search terms | The number of search terms the brand is listed in across all shops, with its average position, each shown with a trend; expandable to the individual term. |
| Top 10 search terms | The number of search terms in which the brand holds a top 10 placement, with its average position, each shown with a trend; expandable to the individual term. |
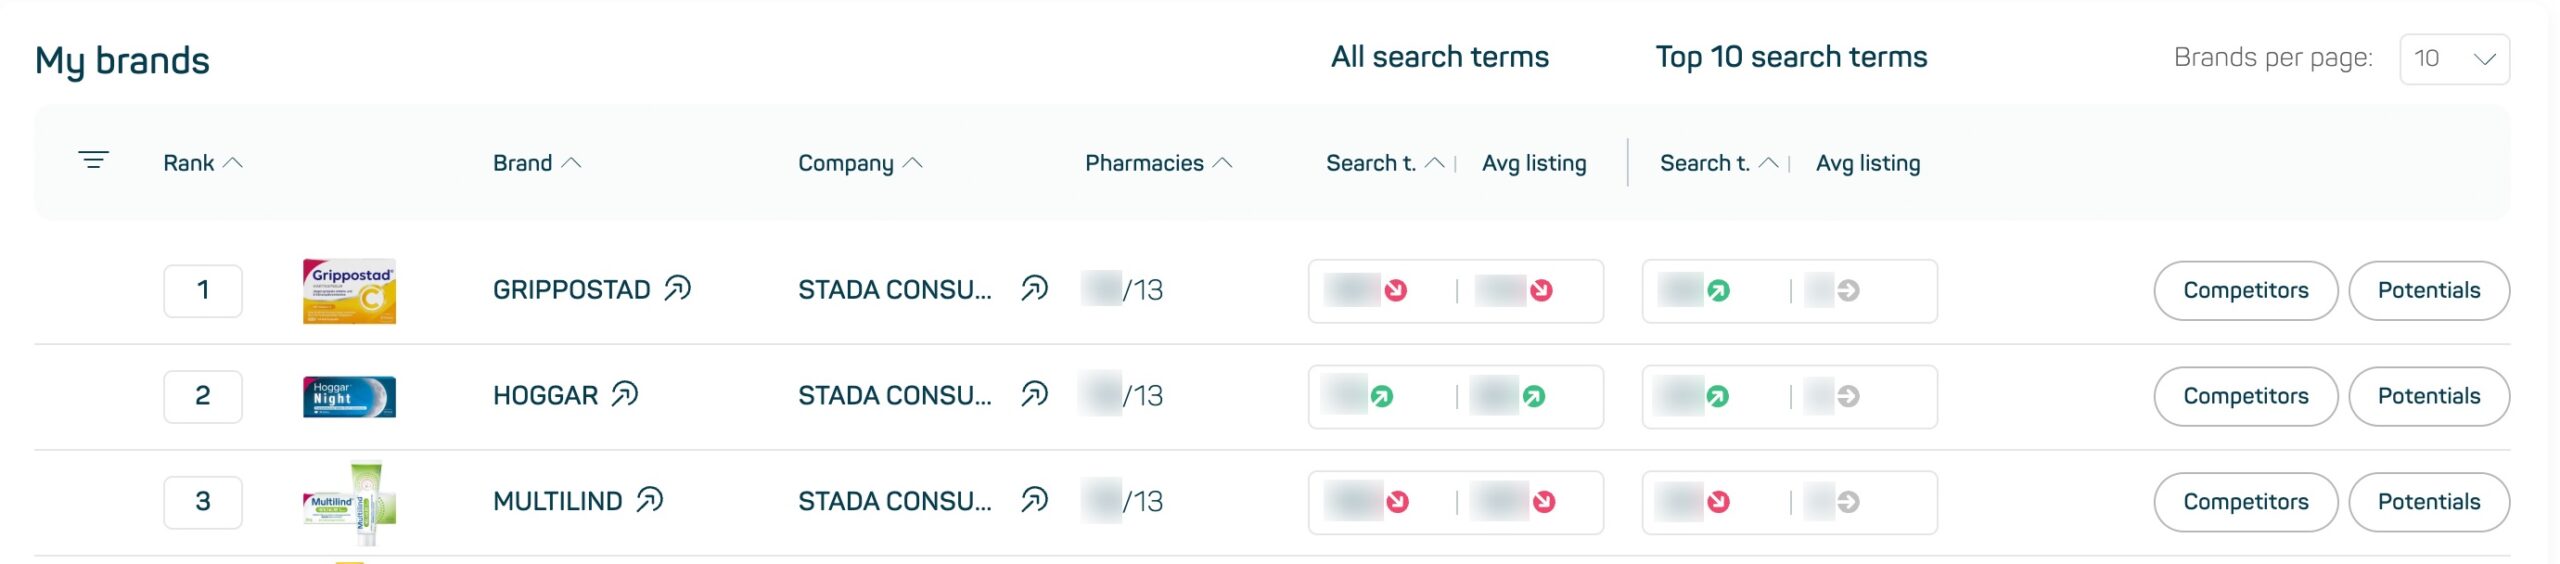
Image 2
Each brand also comes with two buttons (see image 3):
- Competitors shows the top 10 competitors based on ATC-3 classification, with the same metrics and likewise sorted by Sales rAVP MAT. This makes it immediately clear where a brand stands in its relevant competitive field.
- Potentials surfaces concrete keyword opportunities. It shows the search terms a brand is not listed in, but where at least one top 10 competitor holds a top 10 placement. Clicking a search term reveals which shops those competitors are already present in, and which they are not. Each shop shows the number of competitors, and hovering reveals exactly who is listed. This points to where to catch up, or where to be the first to enter a shop.
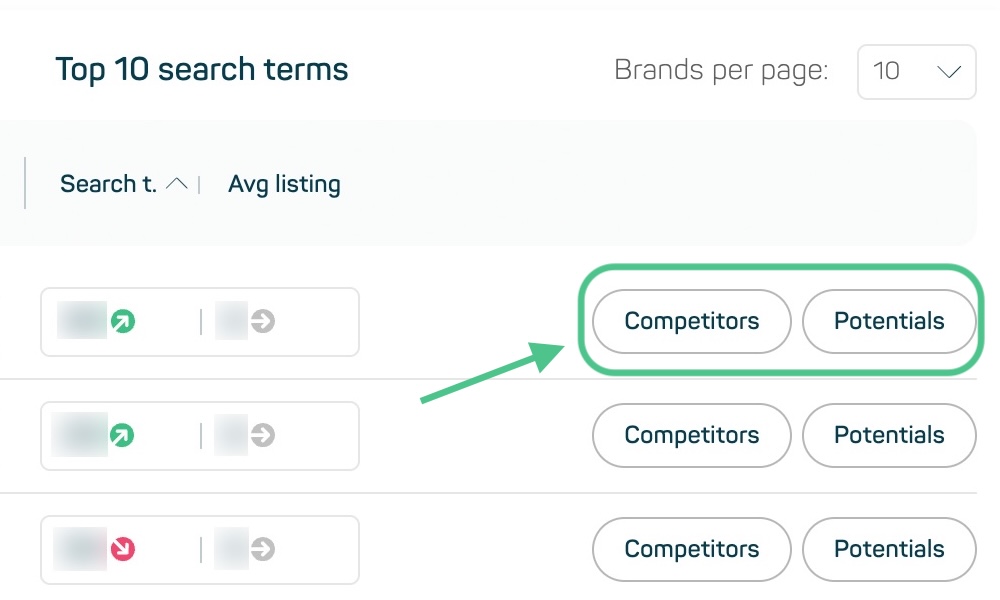
Image 3
Switching to product group level
The „Switch to product groups“ toggle changes the entire view from brand to product group level (see image 4). Tiles, table, Competitors and Potentials all work exactly as they do at brand level, just per product group rather than per brand.
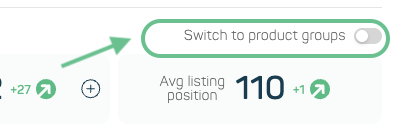
Image 4
Important notes
- The Executive Summary always reflects the company’s own data; any selection below it is independent of that.
- A note on the data: Medpex does not always categorize products correctly, so individual products may occasionally appear under a different category.
More Executive Summaries to come?
Search Visibility is just the beginning. Going forward, the other POS Insights submodules are set to receive their own Executive Summary as well, so that every area can be grasped just as quickly.