OTC Insights Outlook
16.05.2024
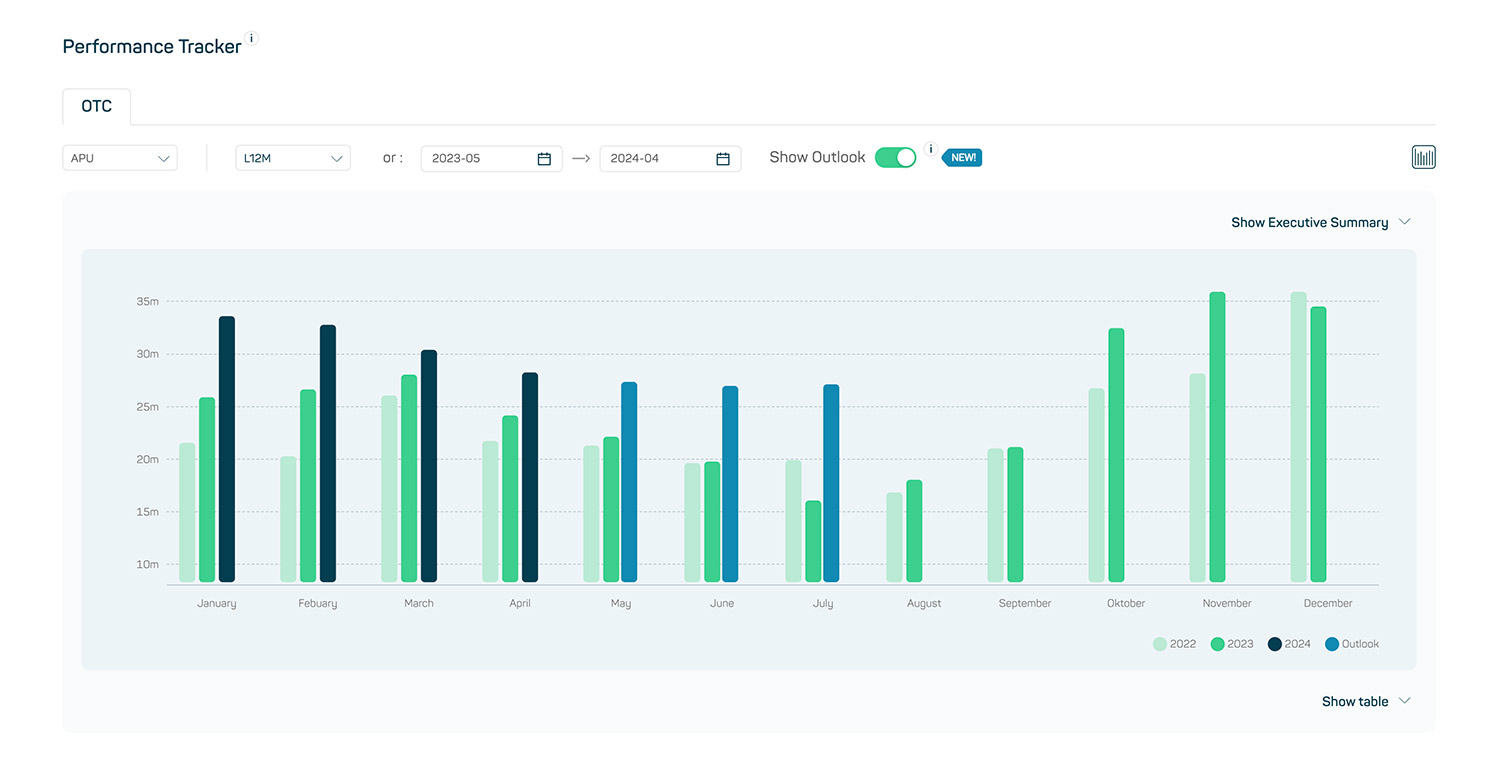
What does the new OTC Insights Outlook submodule offer?
OTC Insights Outlook provides all OTC Insights customers with access to sales and volume projections for the six top-selling ATC-1 markets in the German mail-order market. These projections are presented in bar charts in the Performance Tracker and show market trends for the next three months. OTC Insights Outlook can be activated via the “Show Outlook” switch toggle. The projections do not refer to specific PZN, product groups, or brands but relate to the overall development of the six most important market categories:
How are the projections methods and models for the OTC markets structured?
The projection methods and models for the OTC markets are complex and utilize advanced statistical and machine learning techniques. The projections consider key metrics such as the average weighted sales price (rAVP), sales according to the pharmaceutical company’s selling price (APU), and sales volume in units. The projection models used are hybrid models based on machine learning algorithms like SARIMA, EMA, Prophet, and XGBoost. These models process a variety of parameters, including trends, seasonality, holidays, polynomial trends, rolling-window statistics, and seasonal dummies, to provide precise and meaningful market projections.
How is the updating and verification of the projection models in OTC Insights Outlook conducted?
A significant aspect of the projection models is their dynamism: they are updated monthly and are capable of learning, meaning they continuously improve with each new real data point. The update process is semi-automatic, with the projection calculations being machine-driven and the verification of the projection quality conducted manually (Quality Gate). Various metrics are used to assess the projection quality, including mean squared error (MSE), root mean squared error (RMSE), mean absolute error (MAE), mean absolute percentage error (MAPE), and the correlation between projected and actual values.
What additional measures are taken to ensure accuracy?
In addition, projection quality is verified through backtesting, where projections for historical periods are created and compared with actual data to ensure consistency with real sales trends. This practice helps not only to test the accuracy of the models but also their ability to capture seasonal fluctuations and specific events. This ensures that OTC Insights Outlook provides reliable and robust projections for the key markets in the German mail-order sector.
What role do confidence intervals play in the projection process of OTC Insights Outlook?
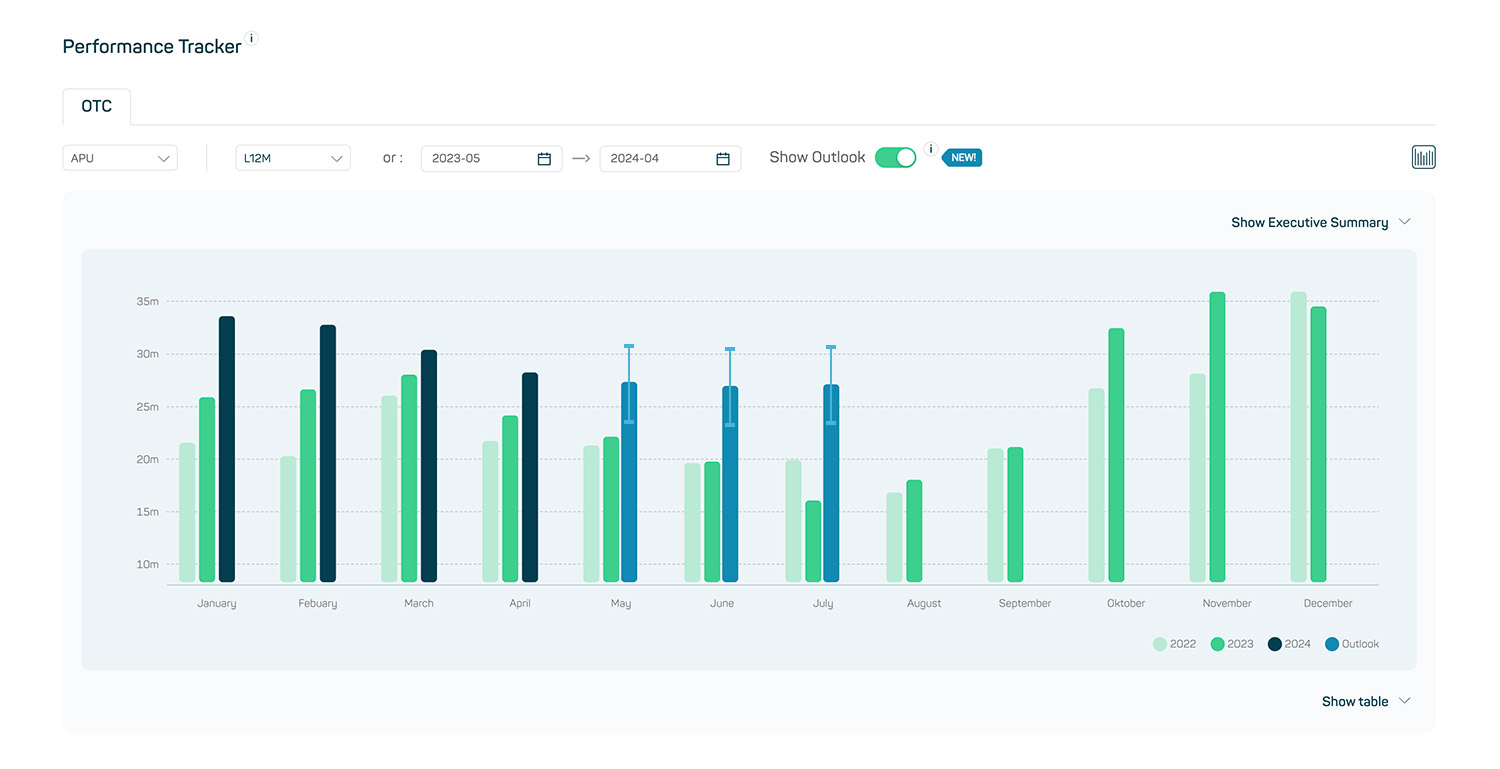
To increase the acceptance and practical applicability of the projection results, it is planned to integrate the so-called confidence intervals of the projections into the Performance Tracker in a further iteration of OTC Insights Outlook. Confidence intervals are statistical measures indicating the range within which the true values lie with a certain probability. In the context of projection, they indicate the boundaries within which the actual future values are expected to lie, based on the current projection models. Confidence intervals help strengthen confidence in the projection models by making transparent how accurate or inaccurate the projections can be under different conditions.
Do you need foresight in your planning?
If there is a need for a longer-term projection in certain cases, we also offer the possibility to unlock projections for periods of up to 12 months individually. This extended foresight allows you to make strategic decisions and plans (resource allocation, budgeting, and market strategies) on a more informed basis, as it provides a comprehensive insight into future trends and market developments.