OTC Benchmark in the Performance Tracker
13.03.2026
With the OTC Benchmark in the Performance Tracker, products, product groups, brands, companies, a combination of them or custom market definitions can now be compared directly. The analysis is available via bar, line, or stacked bar charts, complemented by a value table, and covers a default period of 12 months for all KPIs. (see image)
How to benchmark
The benchmark function is available wherever the OTC Performance Tracker is integrated in the Insights Hub. Via the Benchmark button, a modal opens where a primary and a secondary selection can be defined. Available selections include product, product group, brand, company, a virtual market (combination of multiple elements), or a custom market. (see image)
The current page selection is preselected by default but can be adjusted at any time. An exception applies to ATC markets and the total market, where no default selection is set.
After starting the benchmark, the Performance Tracker switches to a focused view, allowing users to fully concentrate on the visualization and underlying data. (see image)
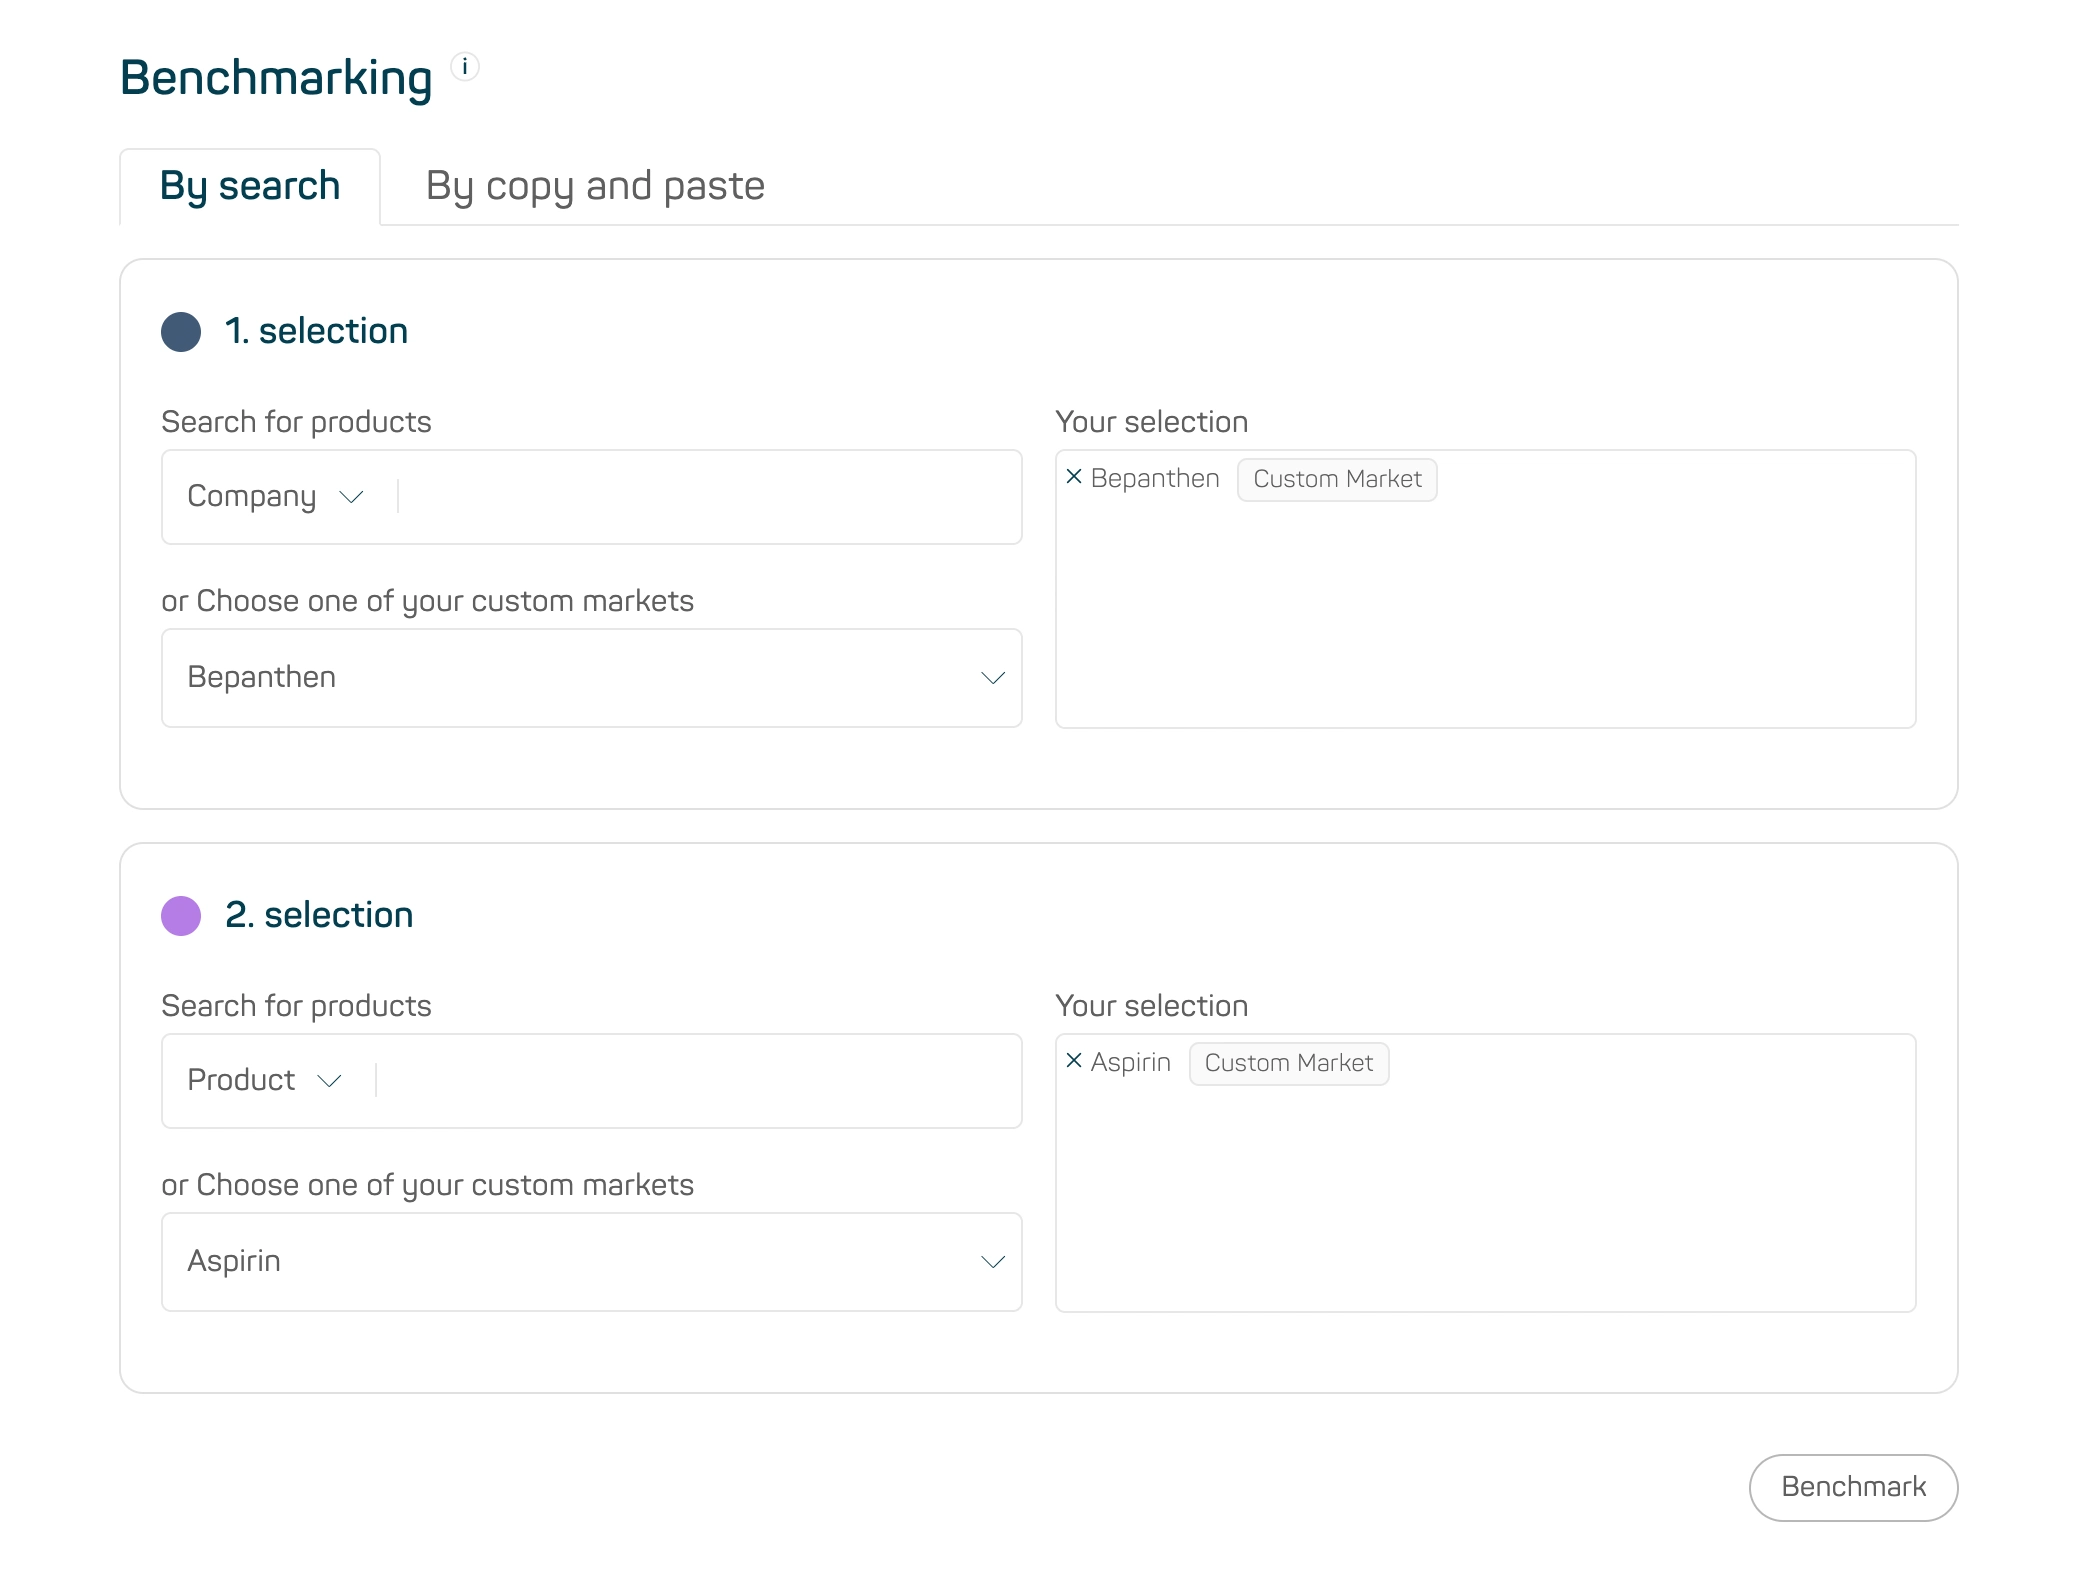
Image 1
The current page selection is preselected by default but can be adjusted at any time. An exception applies to ATC markets and the total market, where no default selection is set.
After starting the benchmark, the Performance Tracker switches to a focused view, allowing users to fully concentrate on the visualization and underlying data. (see image)
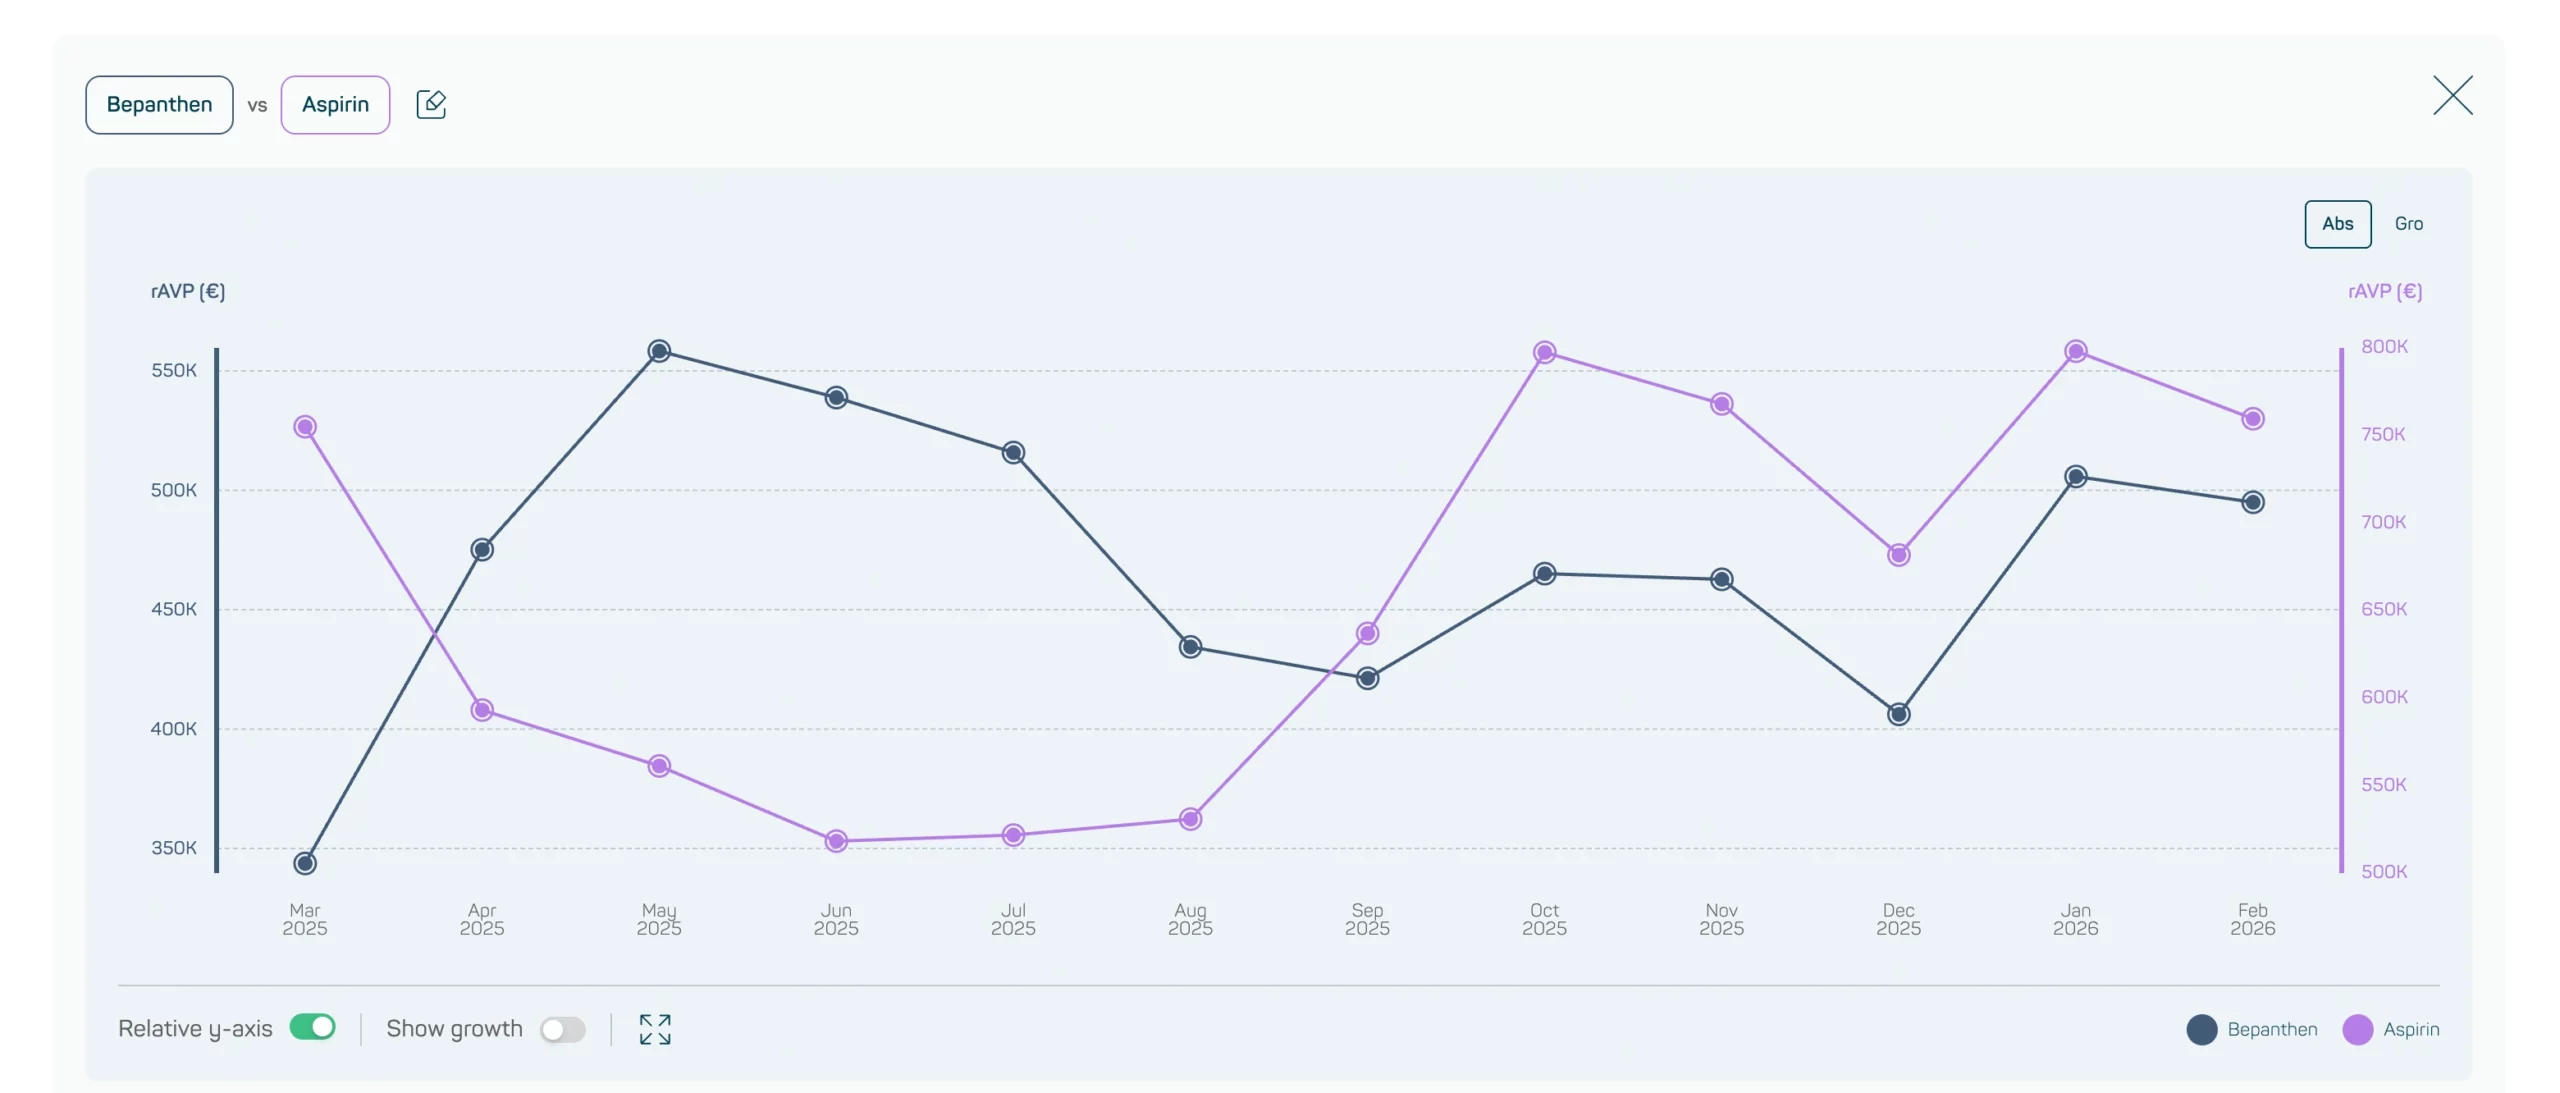
Image 1
The KPI can be selected from twelve available metrics and can be changed at any time during the benchmark. Visualizations and the value table update automatically and reload the corresponding data.
Flexible visualization
Benchmark results can be analyzed using different chart types:
- Bar charts
- Line charts
- Stacked bar charts
Bar and line charts allow the display of absolute values (including primary and secondary axis) as well as growth values.
In the stacked bar chart, both absolute values and the relative market share distribution of the selected options can be analyzed.
Value tables and exportable data
In addition to the charts, value tables display all underlying metrics in a structured format. All tables can be exported via Copy2CSV and used directly for further analysis, presentations, or internal reporting.