Ready for a clearer view and an export that fits your needs?
01.07.2025
We’ve redesigned the Market- and Company Overview to highlight what matters most — with a more compact layout, simple filtering and clear visibility into growth trends.
Prefer flexibility in exports? You can now choose between Excel and CSV formats when downloading OTC Insights, OTC Maps and POS Insights Weekly Summary — whatever fits your workflow best.
Trends spotlighted – new clarity in Market and Company Overview
Where markets and companies change, a clear overview makes all the difference. This release brings more structure and helps make developments instantly visible — with a more compact tile view, a redesigned table view and additional comparison options that support your analysis.
Tile view
The tile view has been visually streamlined and now shows not only absolute values, but also the new key figure “Growth” – the development compared to the previous year (YOY) directly at a glance (see image 1). Thanks to pagination and adjustable entries per page, even larger lists remain easy to navigate. The selected KPI applies globally to both tile and table views, allowing dynamic sorting across all twelve KPIs.
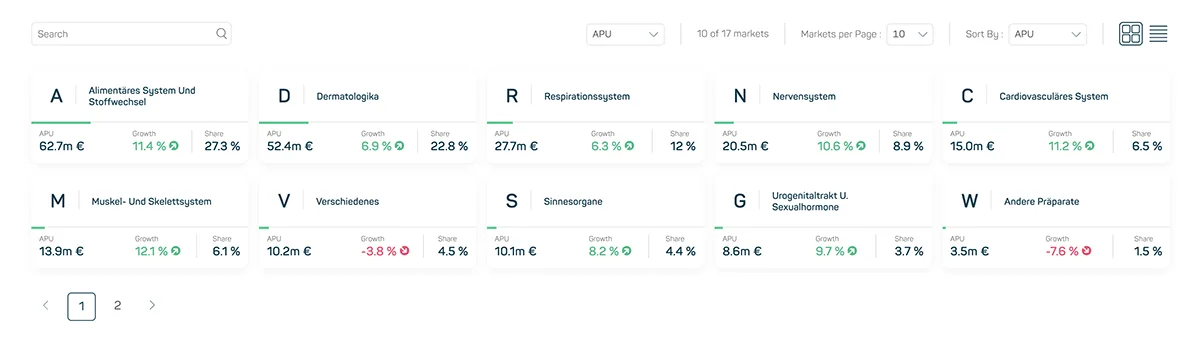
Image 1
List view
The list view has also been redesigned into a structured table format. Alongside name, market share, and the selected KPI, the YOY change is also displayed as Growth (see image 2). All columns are sortable, with default sorting set to the selected KPI (descending). Pagination and flexible display options ensure long lists stay organized and easy to review.
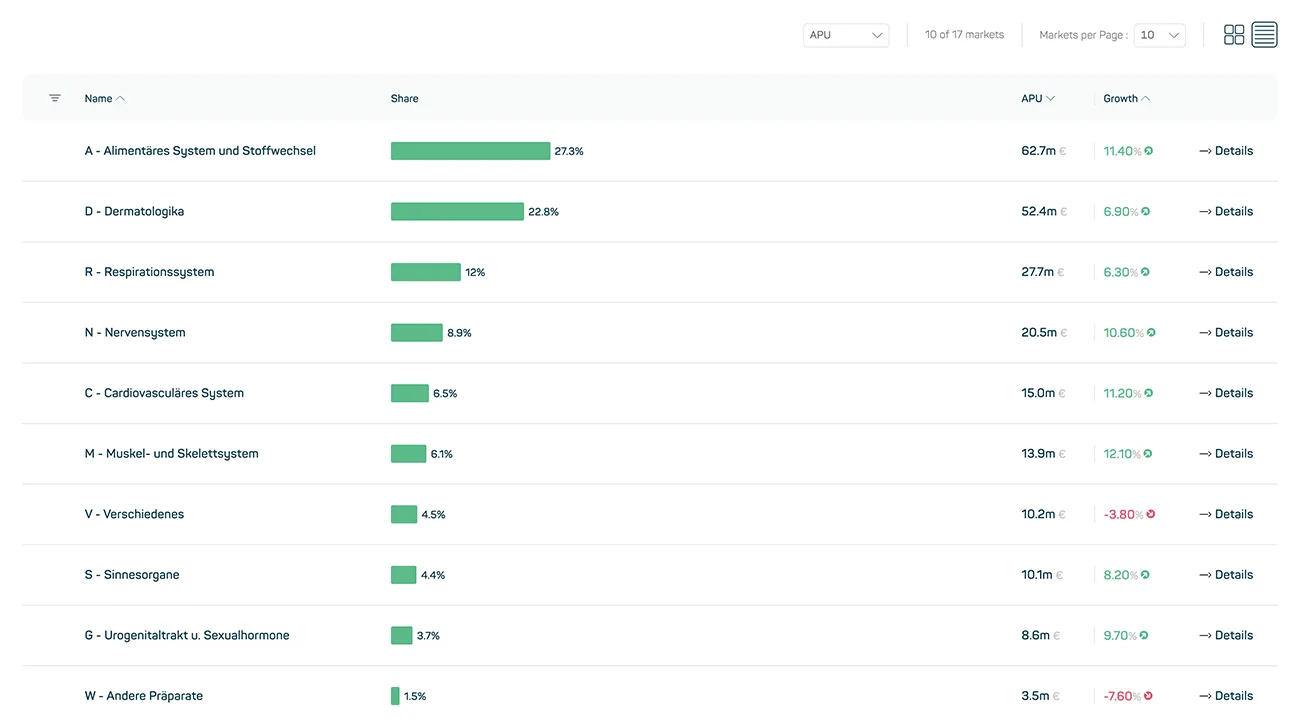
Image 2
Excel or CSV? You decide – new export options in Custom Download
Some prefer CSV, others Excel — now both are available (see image 3). Custom Download has been expanded: For OTC Insights, OTC Maps and POS Insights Weekly Summary, you can now select your preferred file format directly at export. This way, your downloads fit exactly into your personal workflow.
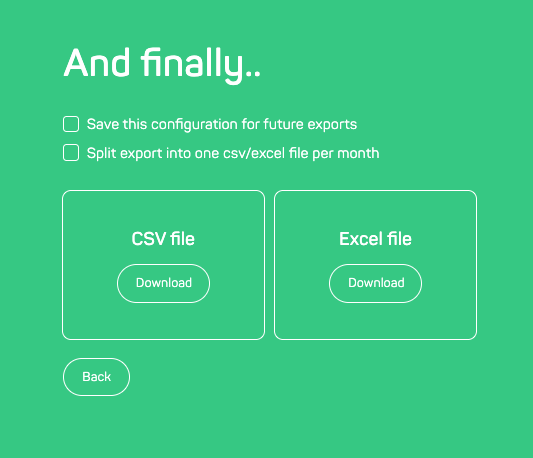
Image 3