Forecasting with OTC Outlook, Custom Market Management, split by payer & more
28.04.2025
With the latest product iteration, the Insights Hub continues to evolve in several key areas: OTC Outlook now enables 12-month forecasts for all ATC-1 and ATC-2 market levels. The new Custom Market Management section provides an overview for managing individual markets. In the Performance Tracker (tab OTC), payment distributions by GKV, PKV, and BAR can now be analyzed over time. Additionally, POS Category Management has been adjusted to daily data.
OTC Outlook – Forecasting for Overall ATC, ATC-1 & ATC-2 Markets
OTC Outlook has been extended: It is now possible to generate 12-month forecasts for the overall ATC market as well as all ATC-1 and ATC-2 markets within the German mail-order segment (see image 1). An overview of the previous functionality is available in the changelog entry from May 16, 2024. Forecasts can be generated for all metrics available in the Insights Hub – including APU, rAVP, Units, as well as the respective rolling KPIs (MAT, YTD, 3M). For non-rolling KPIs, confidence intervals are now also provided (details below), offering better insight into forecast accuracy. The view is further complemented by a value table with selection options for absolute and growth values as well as a new copy function for exporting as a CSV or Excel file (see image 2).
Note: Forecasts are based on total market trends at the ATC-1 and ATC-2 levels and are not intended for individual PZNs, product groups, or brands.
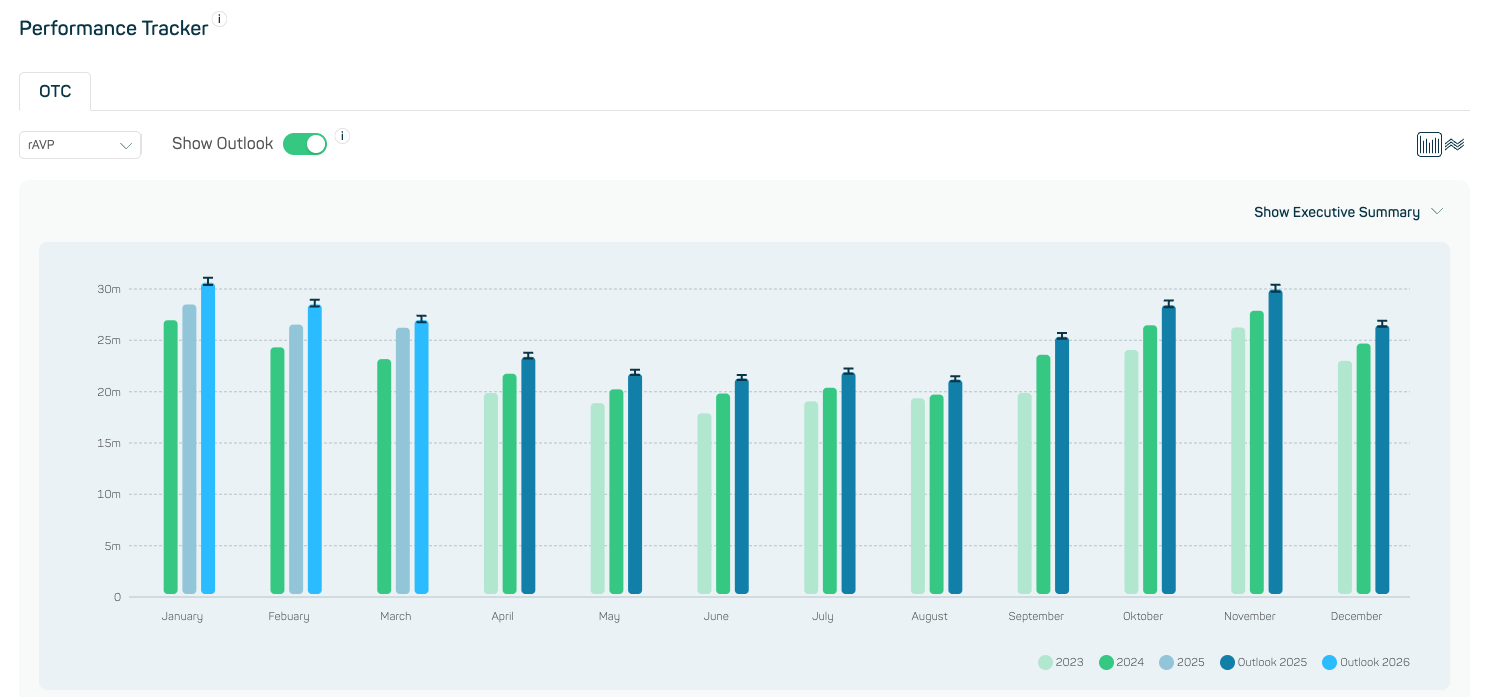
Image 1
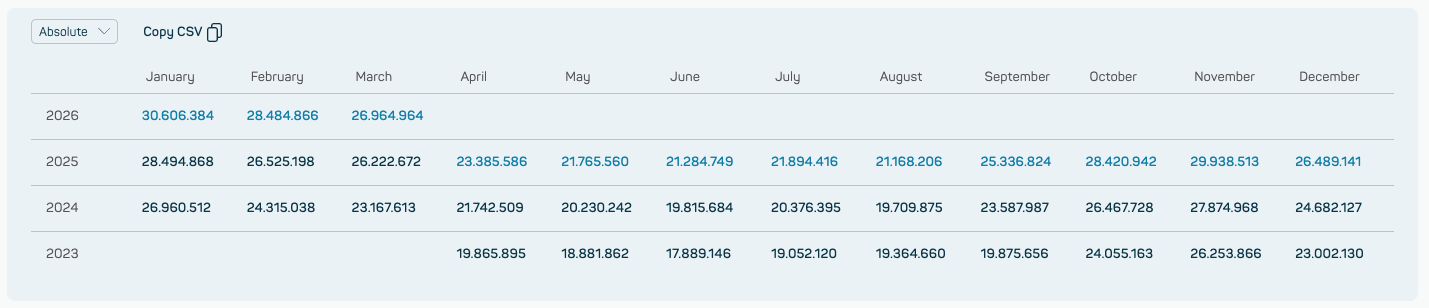
Image 2
Confidence Intervals in OTC Outlook
Confidence intervals shown in OTC Outlook for ATC-1 and ATC-2 levels indicate the expected range in which actual market performance is likely to fall – based on underlying forecast models (see image 3). They provide greater transparency around uncertainty, enhance trust in forecast results, and increase the practical value of forecast-based decisions.
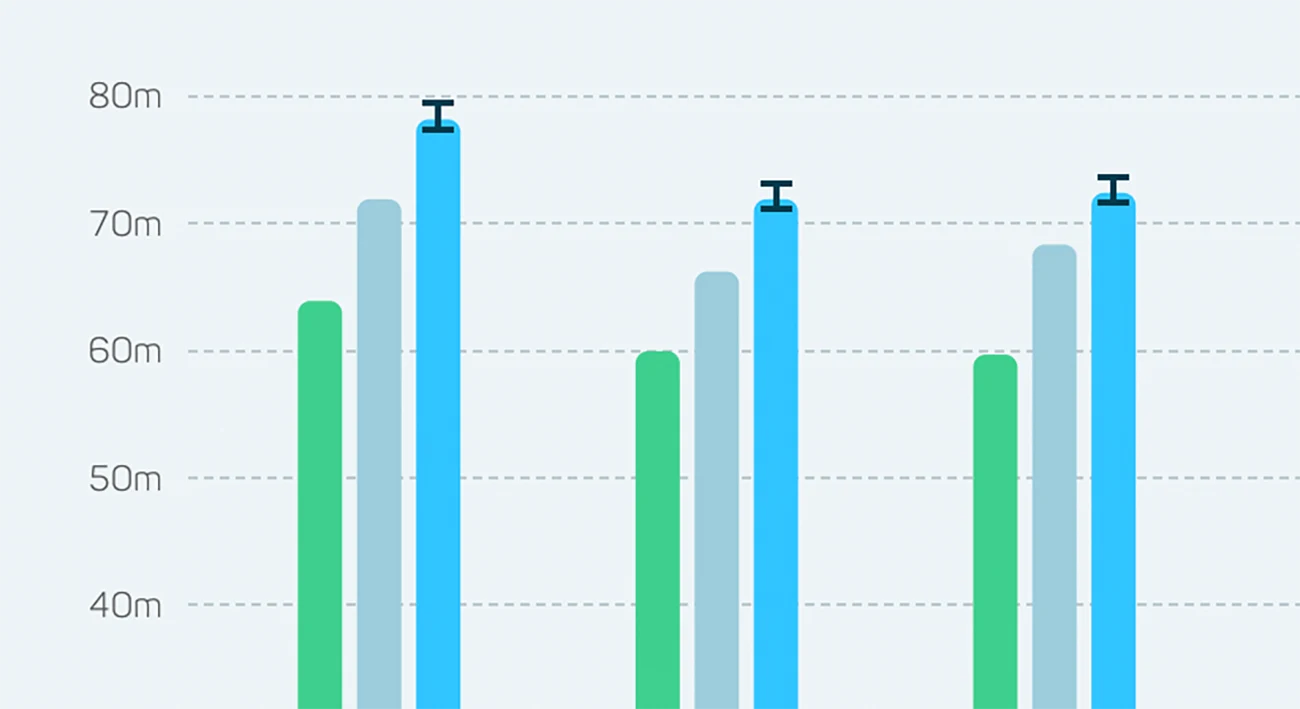
Image 3
New section: Custom Market Management
The new Custom Market Management section (accessible over Quicknavigation) brings structure and clarity to manage Custom Markets within the Insights Hub. The first iteration is a comprehensive overview page, listing all Custom Markets – both personal and shared – in a sortable and filterable table (see image 4). Key information includes the Custom Market name, number of included PZNs, creation and last update date, owner, and number of people the market has been shared with. An icon clearly indicates if a market has been shared with the current user.
The Overview is just the beginning: Upcoming iterations will introduce additional features such as sharing, deleting, and editing single or multiple Custom Markets – all directly from the overview.
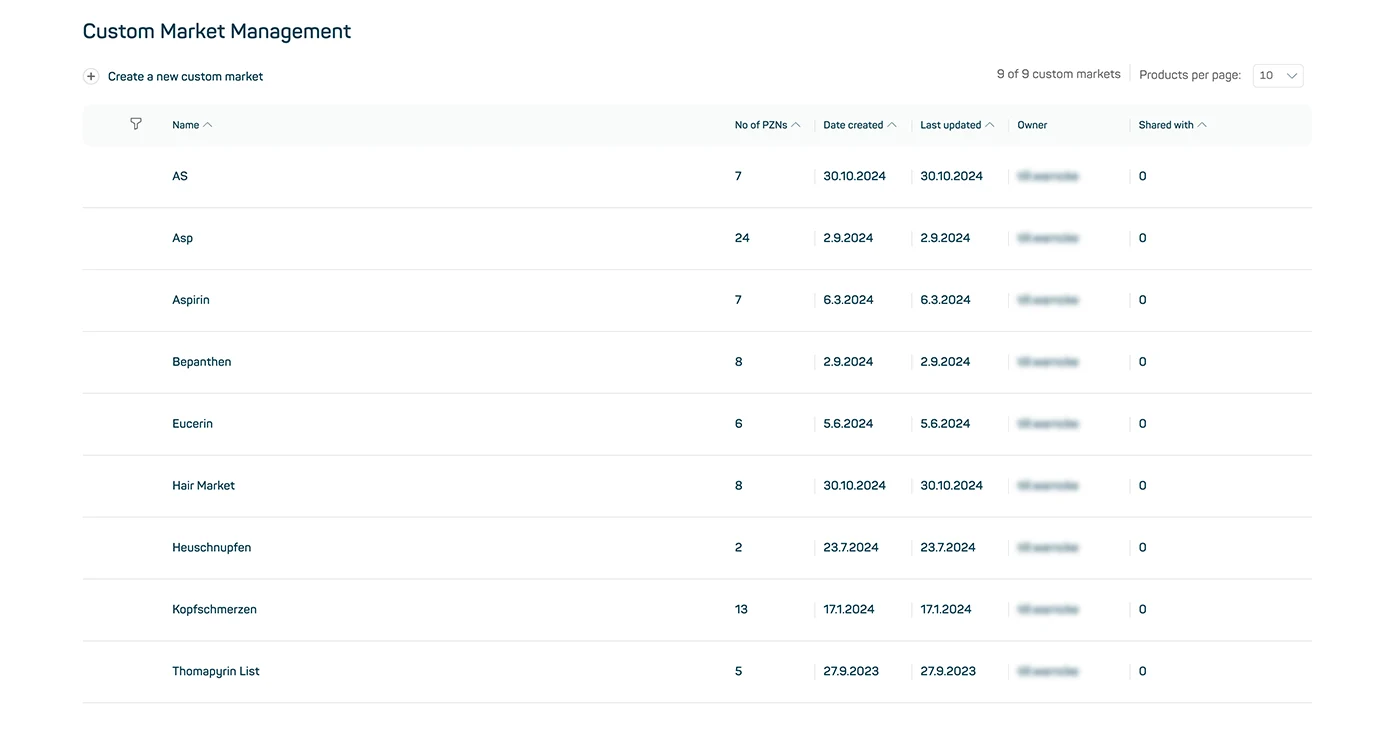
Image 4
KPI split by payer (GKV/PKV/BAR)
A new visualization is now available in the Performance Tracker (OTC tab) on the product detail page: a stacked bar chart shows payment distribution across GKV, PKV, and BAR for the past 12 months (see image). As is standard in the Insights Hub, users can switch between metrics such as APU, rAVP, Units, and their respective rolling KPIs (MAT, YTD, 3M).
The chart provides insights into how payment types evolve over time. A detailed value table complements the view, with options to display absolute, relative, or growth values – plus a new copy function for exporting data as a CSV or Excel file (see image 5).
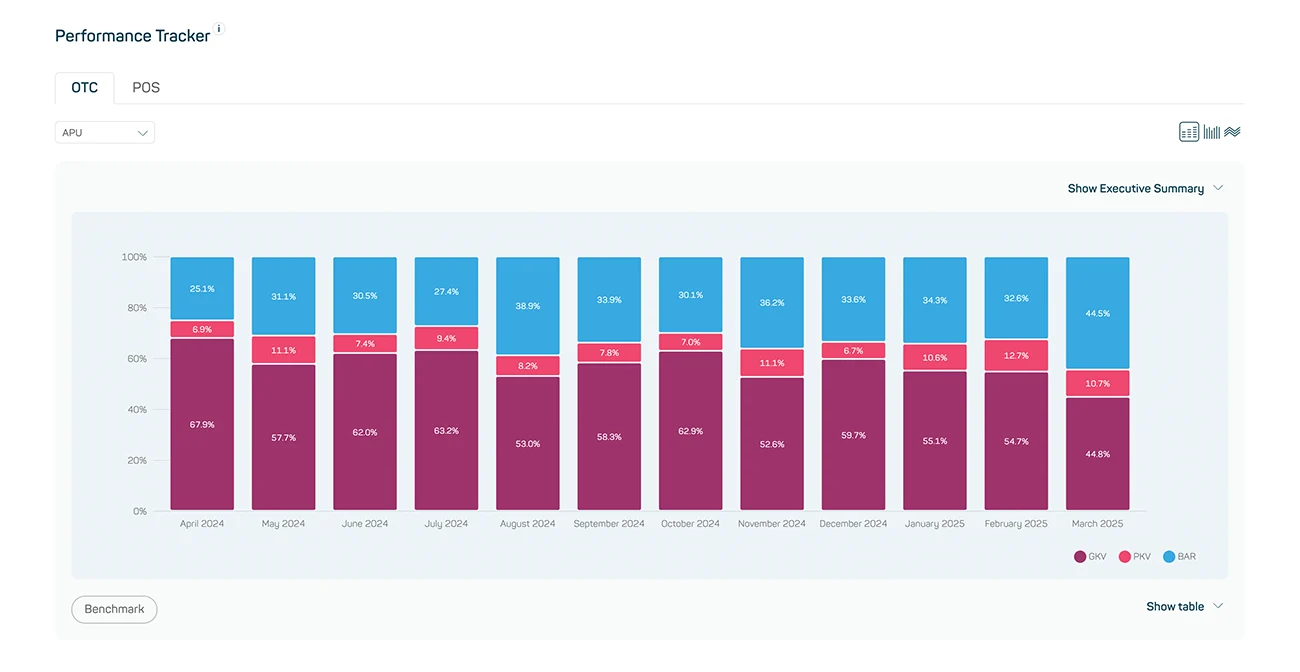
Image 5
POS Category Management adjusted to daily data
POS Category Management has been adjusted to daily-level data instead of weekly aggregations. This change allows for more accurate tracking of PZN categories – particularly for short-term changes. The date reference display has also been improved and now includes the day, calendar week, month, and year (e.g. 13 Mar / CW11 / Mar 2025).
This unified display format has also been applied to POS Live Availability and POS Content & Quality Control for consistency across modules.