Persona Insights, unified display of reference data, and revised overview page
27.03.2025
With the latest product iterations, the Insights Hub has been expanded with a new module: Persona Insights. This module enhances OTC Insights by enabling target group-specific market analyses based on gender, age cohorts, and personas. Additionally, the display of reference data has been standardized across the entire Insights Hub and the overview page has been redesigned to provide clearer orientation.
Persona Insights
Persona Insights expands OTC Insights by offering the ability to conduct market analysis tailored to specific target groups. The new module consists of three submodules: Overview, Performance, and Top 100.
The central components of the module are the so-called personas, which represent typical members of different consumer groups. These personas are based on transaction data and associated socio-demographic characteristics. A total of ten personas have been developed – five female and five male – representing different age cohorts.
Each persona is given a name, a picture, and information about their age, profession, and leisure activities to make them as tangible and relatable as possible. The female personas are: Renate Roth (60+), Lena Ludwig (50–59), Nicole Neumann (40–49), Amira Alvar (30–39), and Farah Fischer (18–29). The male personas are: Hans Hoffmann (60+), Wolfgang Weber (50–59), Michael Mayer (40–49), Sebastian Schneider (30–39), and Rami Richter (18–29).
These personas represent specific target groups and enable differentiated analysis by gender and age group – regardless of which submodule is being used.
Submodul: Overview
The Overview provides a comprehensive market overview of your customer base. The data is segmented by gender and further divided into five age cohorts per gender. Each persona is presented with a name and a typical profession to make the representation more tangible.
The analysis begins with a selection level where you can choose between product, product group, brand, company, and custom market. By default, “All Markets” is selected (the total market of all non-Rx products).
The view in the Overview submodule follows a classic socio-demographic drill-down: Starting from the total market size, the data is first broken down by gender, and then further detailed into five age groups per gender. This creates a clearly structured view of the buyer segments within the target group.
To the right of the selection, absolute values and year-over-year (YOY) growth are displayed. In the next step, you can choose one of twelve available KPIs – Sales by APU, Sales by rAVP, or Units, each of which can be shown for MAT, YTD, or the last 3 months (3M).
Below that, the selected data is broken down by gender, including relative and absolute market shares as well as YOY growth rates. This is followed by a breakdown by age group: 18–29, 30–39, 40–49, 50–59, and 60+. Female personas are shown on the left side, male personas on the right.
Using the “Show persona details” feature, you can access additional information about each persona. Directly next to it, the top product for the selected persona in the current month is displayed – including direct navigation to the Top 100 submodule.

Image 1
Benchmarking in Overview
Clicking the Benchmark button opens a dialog box where a primary selection can be compared with a secondary selection.
In the “By Search” tab, you can make a single or multiple selection from products, product groups, brands, companies, or a custom market. Combinations – for example, a product and a brand – are also possible. The “By Copy & Paste” tab allows you to directly paste PZNs to quickly and easily perform a benchmark analysis.
After selecting the comparison sets, the KPI values for both selections, including the year-over-year (YOY) change, are displayed on the right-hand side.
As in the standard Overview view, this is followed by segmentation by gender and persona – including relative market shares, absolute values, and their development over time.

Image 2
Submodul: Performance
In this submodule, the relative and absolute market share of individual personas can be analyzed and compared over a 12-month period. Analyses can be performed for individual products, product groups, brands, companies, or custom markets, with “All Markets” set as the default.
Additionally, twelve KPIs are available for selection, familiar from other areas of the Insights Hub. You can also apply targeted filtering by persona to compare different target groups and set benchmarks. The calculation of the relative market share is always based on the selected personas.
Further down, a value table is displayed – similar to the Performance Tracker (tab OTC) – showing absolute values, relative shares, and year-over-year (YOY) growth.
Download Function of the view
The view in Performance can be downloaded as a CSV or Excel file. Both the selected scope (product, product group, brand, company, or custom market) and the persona filters are taken into account. Downloads are accessible in the My Downloads section of the download section.
By default, data for the last twelve months is displayed, with the option to download data going back up to three years. Each export file (Excel or CSV) contains not only the master data but also the values for Sales by APU, Sales by rAVP, and Units, based on the selected scope and persona filters.
Important: An export is only possible if a specific selection (product, product group, brand, company, or custom market) has been made. The “All Markets” setting is excluded from export for both Excel and CSV formats.
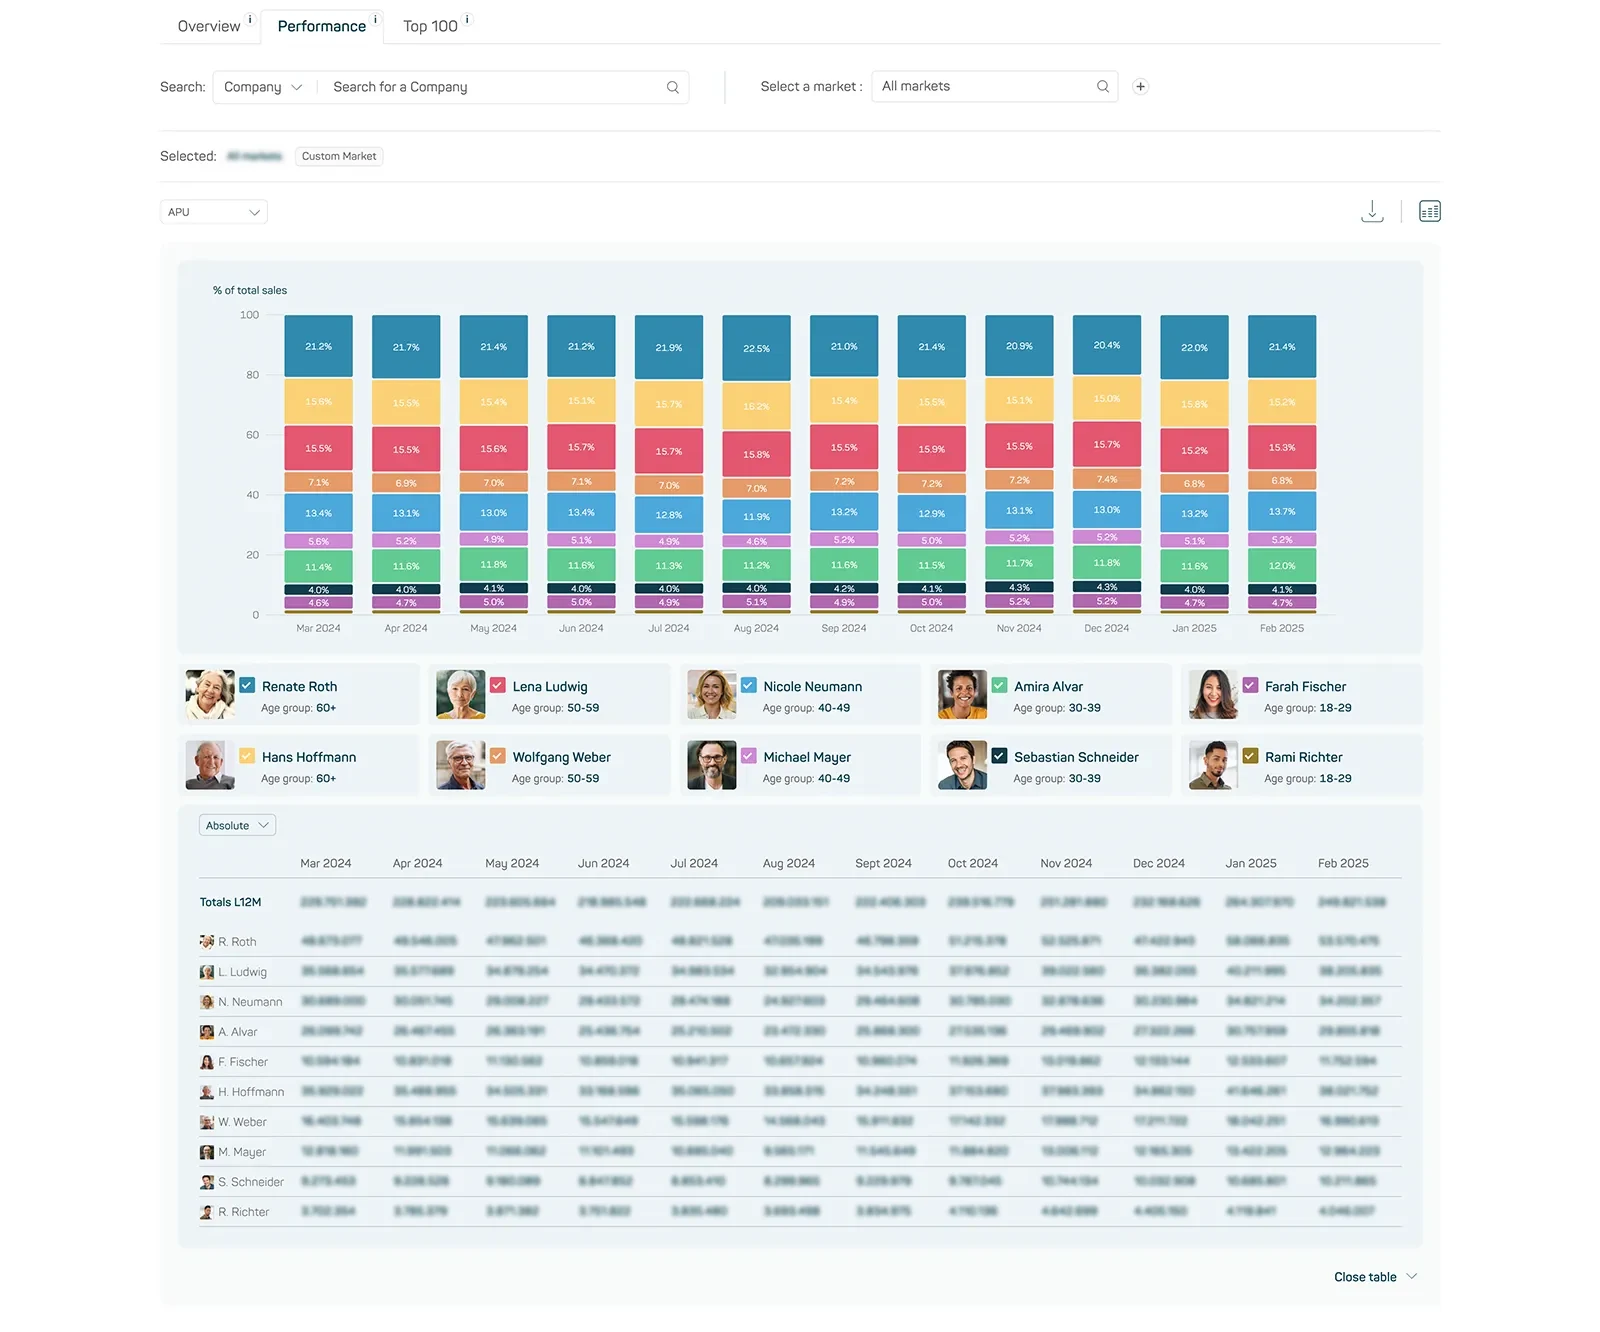
Image 3
Submodule: Top 100
The Top 100 submodule provides a detailed analysis of the purchasing behavior of individual target groups. It helps identify buying patterns and derive targeted opportunities for cross-selling and upselling.
The analysis is based on the selection of a single persona, for which the top 100 products, product groups, brands, or companies are individually determined. To the right of the selected persona, additional relevant e-commerce metrics are displayed – including purchasing power, average basket size (units), and average basket value (€).
For further refinement, you can choose between the dimensions Product, Product Group, Brand, and Company. Additionally, twelve KPIs are available: APU, rAVP, and Units, each selectable for MAT, YTD, or the last 3 months (3M).
The number of displayed entries can be flexibly adjusted to 10, 25, or 50 rows per page.
The results are shown in an interactive table, which varies slightly depending on the selected dimension. However, the following columns are consistently available across all views:
- Rank (sortable): Ranking in the reference month
- Trend (sortable): Change in ranking compared to the previous period
- Previous Months: Rankings for the past three months in descending order
- Values (sortable): Value of the selected KPI, used for the ranking
- Growth (YOY) (sortable): Change compared to the same month of the previous year
Depending on the selected dimension, the following columns are also displayed:
- Product: Product name and associated PZN in the “Product” column
- Product Group: Name of the product group and associated company in “Product Group”
- Brand: Brand name and associated company in “Brand”
- Company: Company name in the “Company” column
A search and filter function is available for all selection types, allowing targeted searches for product, group, brand, or company names.
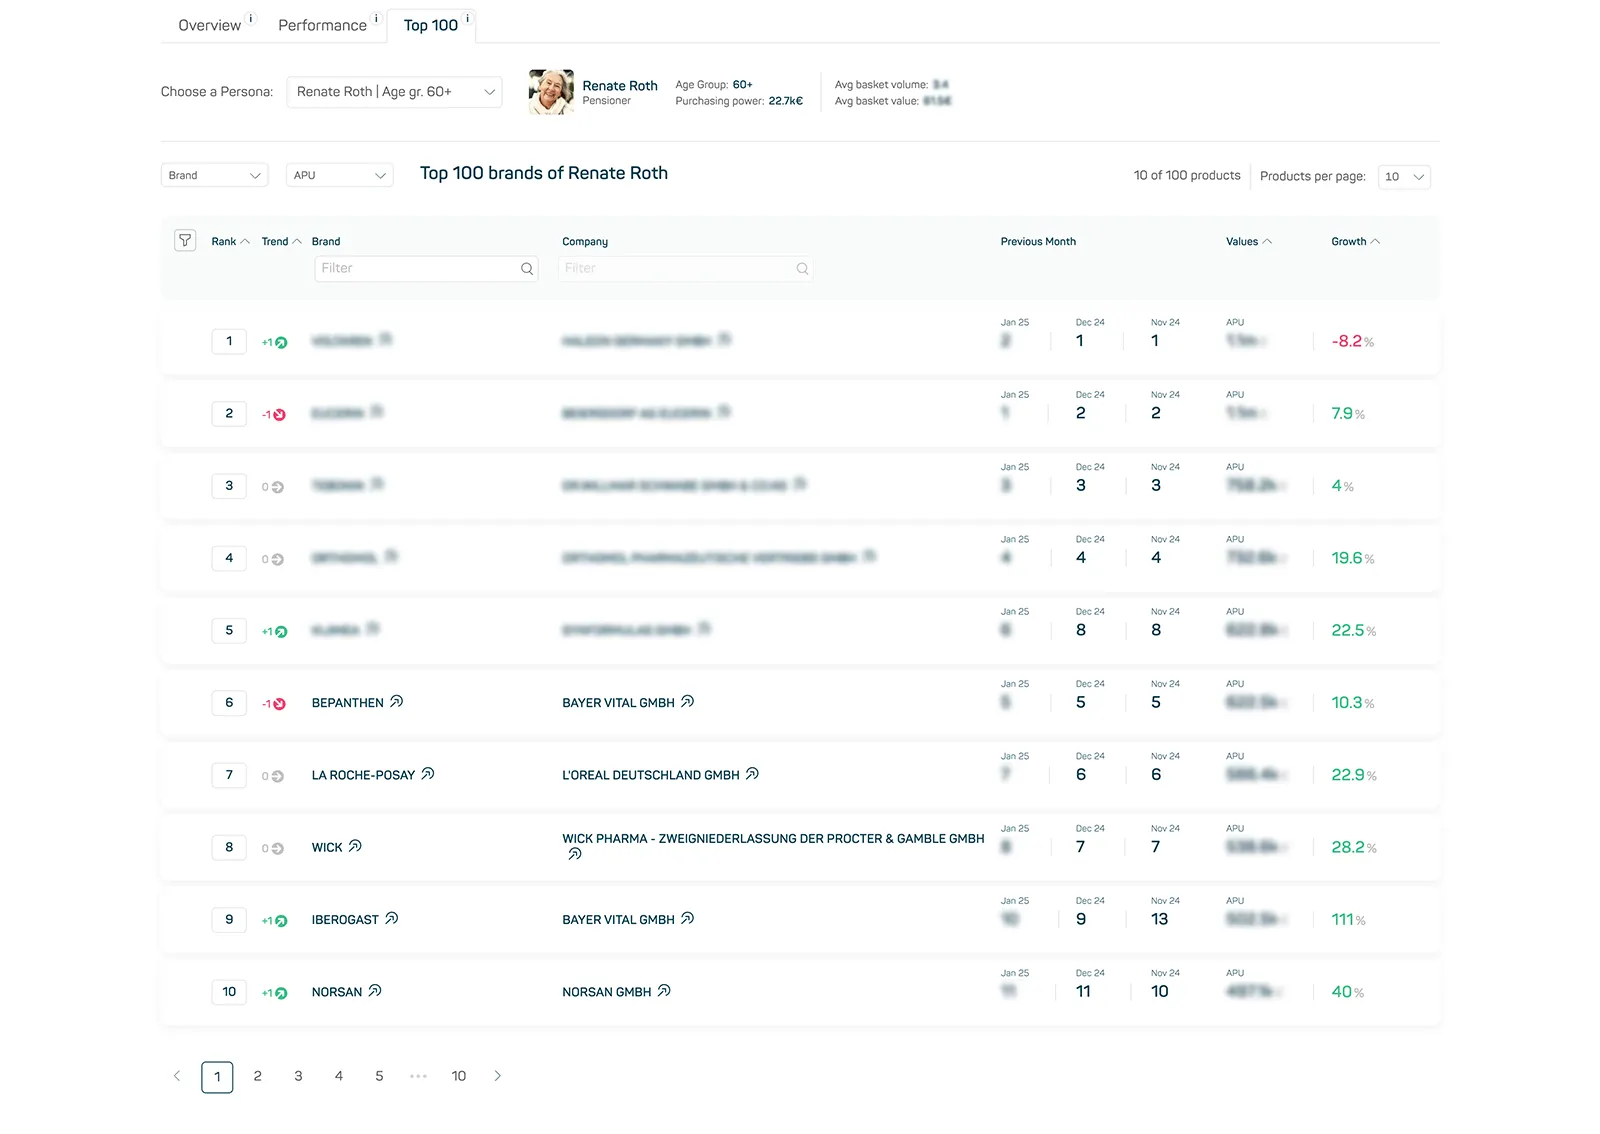
Image 4
Unified display of reference data in the Insights Hub
From now on, reference data in the Insights Hub is consistently displayed in the top right corner of each view. Depending on the module and submodule, the reference period is shown as day, week, or month, providing clearer orientation.
Below is an overview of the reference period used in each module or section:
| Modul / Bereich | Ansicht | Referenzzeitraum |
| POS Insights | Weekly Summary | Week |
| Content & Quality Control | Day | |
| Live Availability | Day | |
| Search Visibility | Week | |
| OTC Insights | Market Overview | Month |
| Company Overview | Month | |
| Persona Insights | Overview | Month |
| Performance | Month | |
| TOP 100 | Month | |
| Product detail page | Product Details | Month |
| POS Performance Tracker | No reference | |
| POS Category Management | Week (soon Day) |
Revision of the Overview page
The overview page of the Insights Hub has been redesigned to provide a clearer structure, improved navigation, and faster access to relevant content.
At the top, you’ll find a brief introduction along with embedded changelog entries, keeping you informed about the latest updates. Below that, the four main sections – POS Insights, OTC Insights, Download Section, and Persona Insights – are available for direct navigation.
You can access more detailed information about each module via the “Product Details” link. If you don’t have access to a specific area, you can easily get in touch using the “Book a consultation” button.