Change rates in POS Weekly Summary and POS Search Visibility & Custom Markets via Batch Upload
06.12.2024
The latest product iteration allows you to view the change rates of the previous week in POS Weekly Summary and POS Search Visibility. Additionally, you can now create Custom Markets via Batch Upload and set up multiple markets (Batch) at once.
Changes in a nutshell
- Trends in POS Search Visibility: Track the change rate of the previous week for each search term in the “Search Terms” tab. Additionally, the new “Trend” sort function allows you to sort search terms by trends or negative developments. New terms that have not yet been ranked always appear at the end of the sorted list.
- Change Rates in POS Weekly Summary: The POS Weekly Summary now displays change rates for the metrics: Cat. Visibility, Availability, Rebates, rAVP, Ratings, and No. of ratings. The change rates are shown as percentage points (Cat. Visibility, Availability, Rebates), percentage values (rAVP) and absolute differences (Ratings, No. of ratings). This helps you clearly track developments and deviations in a week-to-week comparison.
- Create Custom Markets via Batch Upload: Create multiple Custom Markets at once by uploading one file. Simply drag your file into the upload field, and the system will automatically create markets based on the provided data.
Detailed information can be found below.
Trends in POS Search Visibility
By now, you can track the change rate of the previous week for each search term in the “Search Terms” tab. This value is displayed as a number next to a trend arrow, making it easy to see whether the trend is positive or negative. Additionally, the new “Trend” sort function allows you to sort search terms by their change rates and identify trending or declining terms (see image 1). Search Terms that were not ranked in the previous week are marked with a “–” and will appear at the end of the list when sorting, regardless of the sort direction. Once values from previous weeks become available, this marker will disappear.
These enhancements allow you to respond effectively to trends, spot opportunities early, and evaluate the performance of your search terms with ease, whether they show positive or negative changes.
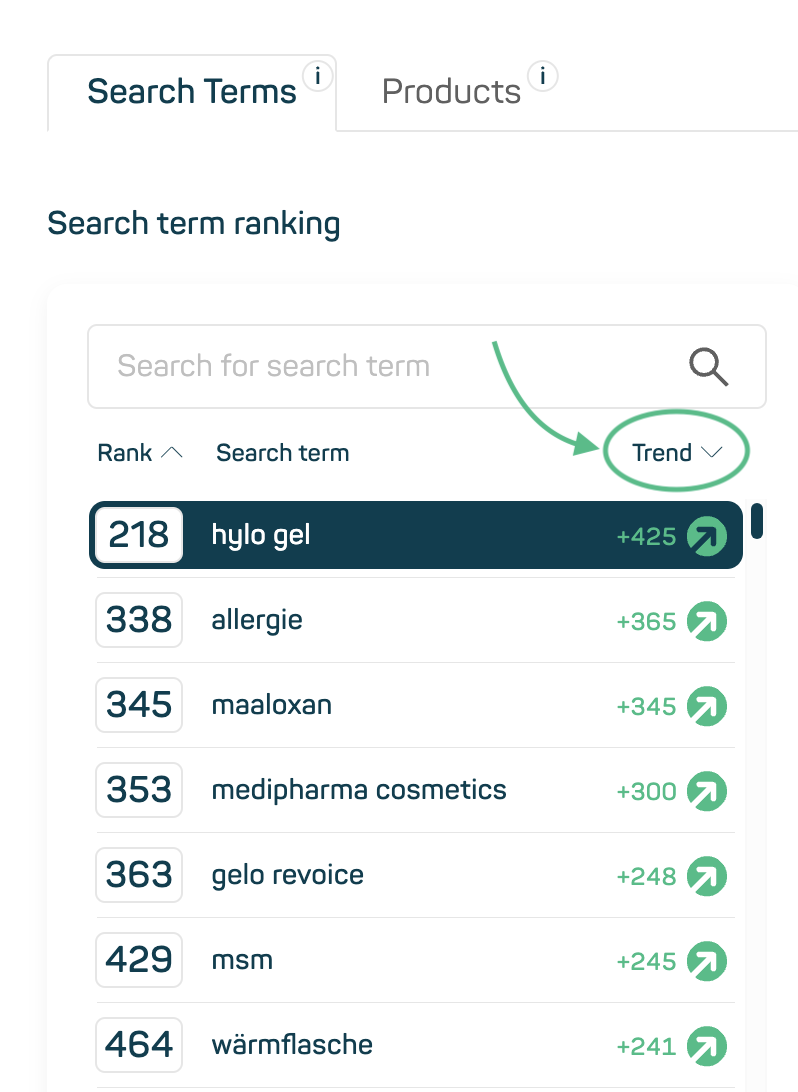
Image 1
Change rates in POS Weekly Summary
We extended the POS Weekly Summary by adding change rates and trend arrows for various metrics, allowing you to analyze last week’s developments more precisely (see image 2). The changes include:
- Percentage Point Changes for “Cat. Visibility”, “Availability”, and “Rebates”
- The change rate compared to the previous week is displayed in percentage points next to the current week’s scores.
- Example: A change from 85% to 90% is shown as +5 percentage points.
- Percentage Changes for “rAVP”
- The change rate compared to the previous week is displayed as a percentage next to the current week’s score.
- Example: A change from 10€ to 12€ is shown as +20%.
- Absolute Changes for “Rating” and “No. of Ratings”
- The absolute difference compared to the previous week is displayed next to the current week’s scores.
- Example: An increase in ratings from 128 to 140 is shown as +12.
These updates provide a more accurate analysis of the data, clearly highlighting how values have changed compared to the previous week—whether in relative or absolute terms, depending on the metric. With these enhancements, you can keep a closer eye on key POS performance indicators and respond more effectively to trends and deviations.
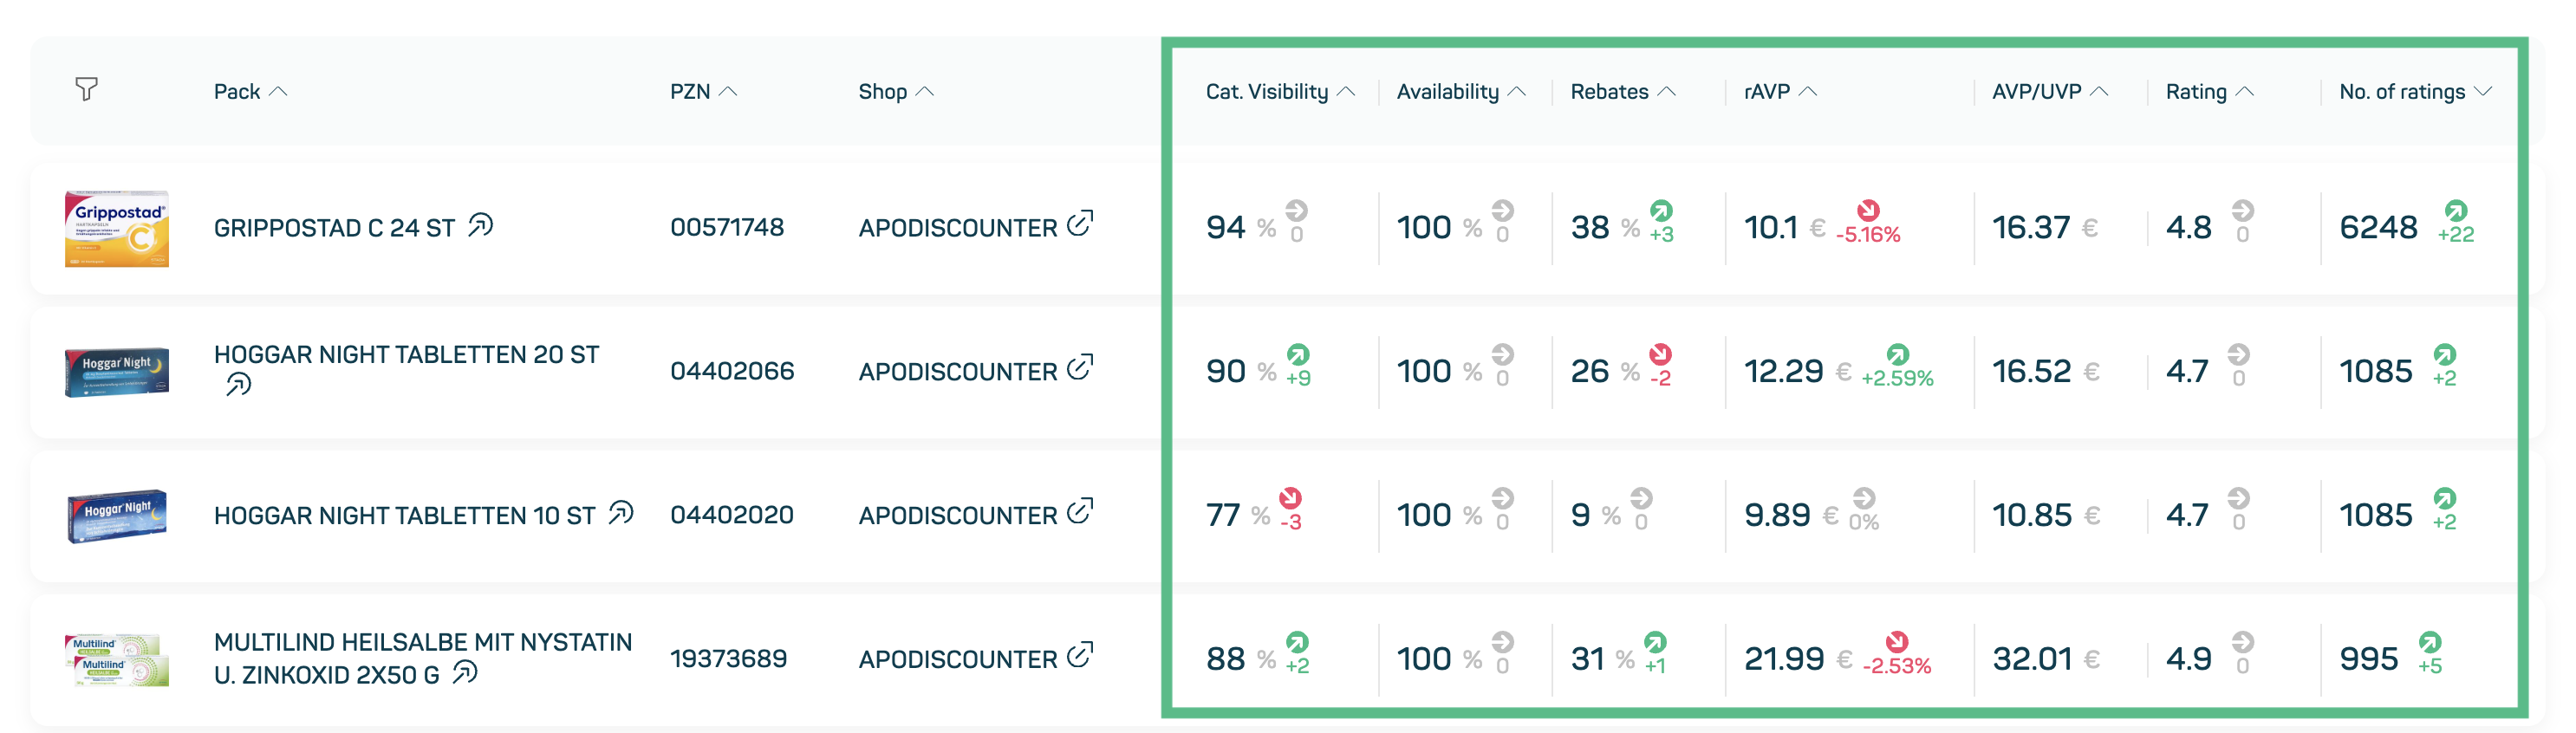
Image 2
Create Custom Markets via Batch Upload
The new batch upload feature allows you to create multiple Custom Markets simultaneously. Simply drag a file into the upload field, and the system will automatically create the defined markets based on the data provided (see image 3).
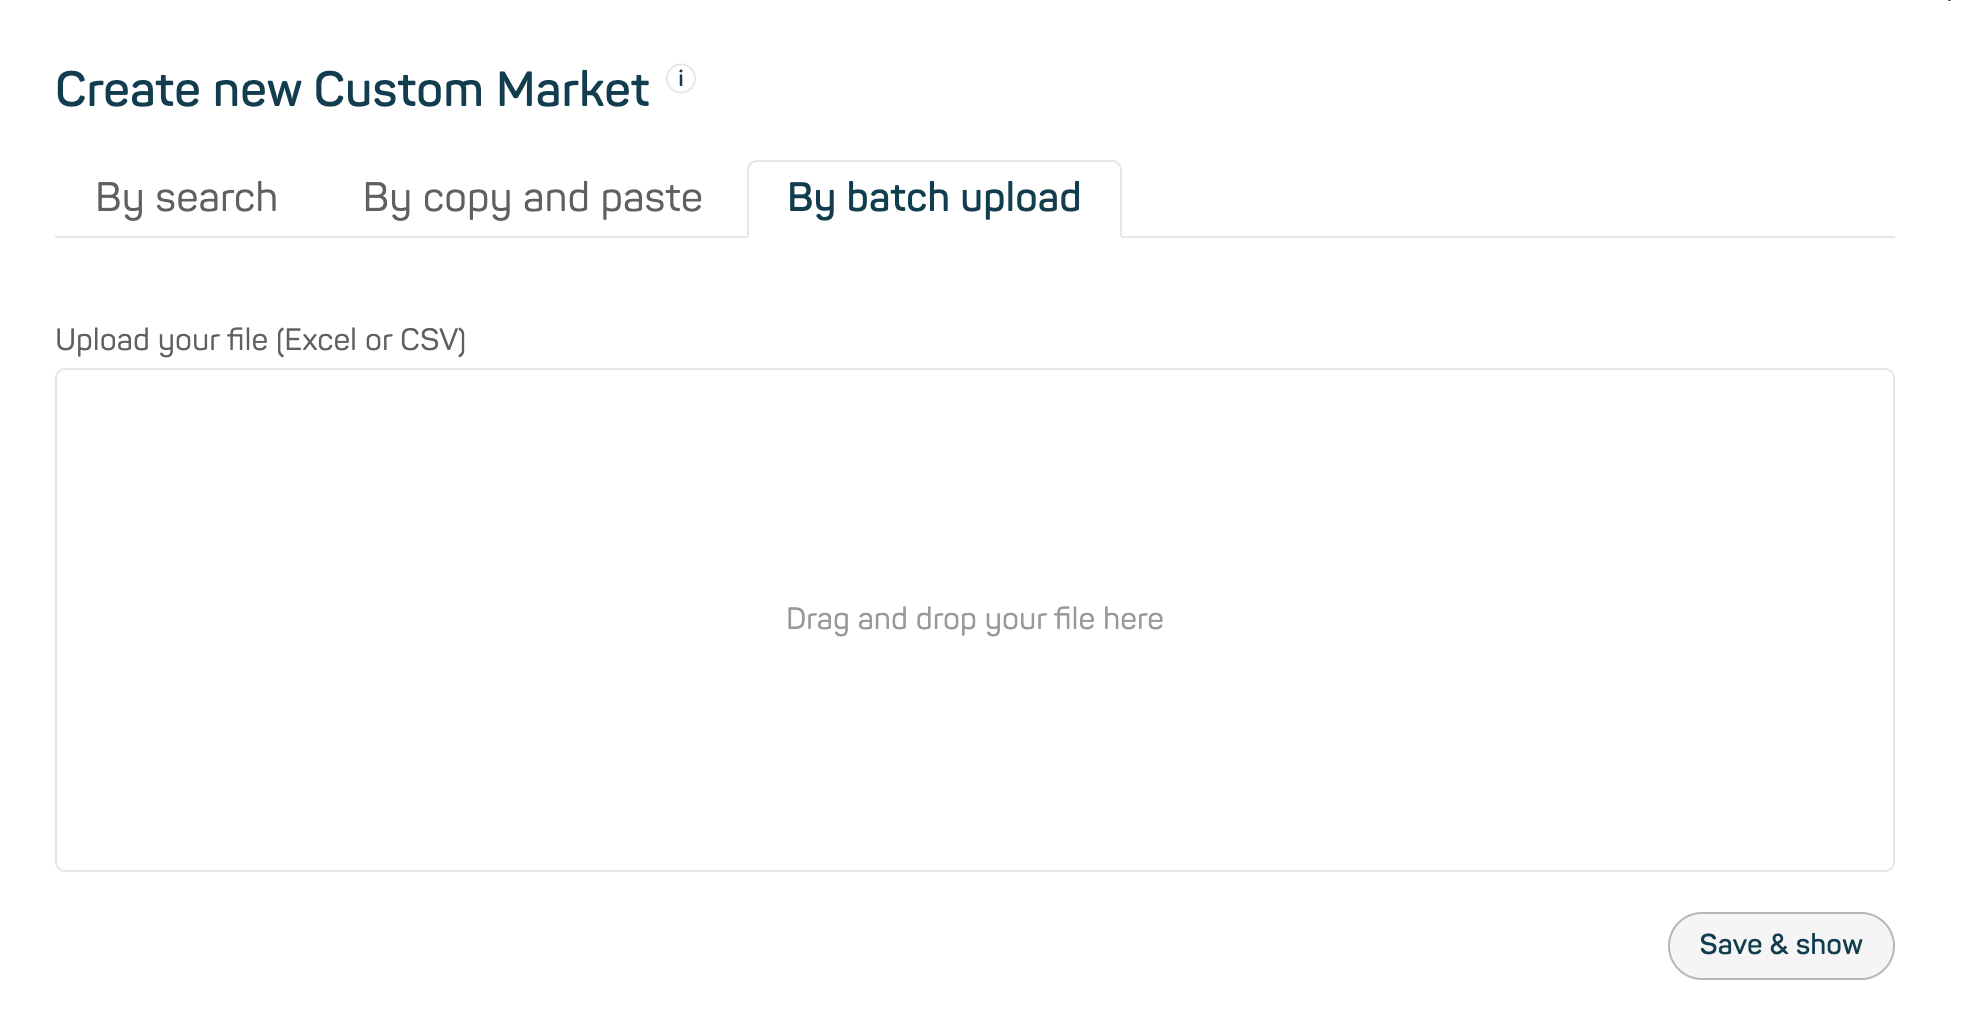
Image 3
How the Batch Upload works:
- Drag-and-Drop: Drag your file with Custom Market data into the upload field.
- File type restrictions: Only files in .xls, .xlsx, or .csv formats are accepted. Any other file types will be rejected.
- Automatic Creation: Based on the uploaded file, all markets will be automatically created with their associated PZNs in the system.
File requirements:
- PZN limit per market: Each market can include up to 000 PZNs. If this limit is exceeded, the system will display an error, and the affected market will not be created.
- Required file structure: The file must contain exactly two columns:
- „pzn“ (first column): Represents the unique product identifier.
- „market“ (second column): Specifies the market associated with each PZN. Incorrect headers or extra columns will lead to file rejection.
- Headers are optional but, if excluded, the order of the columns must be respected.
Additional important notes:
- Validation and error handling: The system validates the uploaded file for correct format, structure, column order, and compliance with the PZN limit. Errors are reported within the modal, detailing issues such as format mismatches, missing data, or exceeding PZN limits.
- Overwriting existing markets: Uploading a file with markets that already exist in the system will override the current configuration for those markets with the new data. Note: Ensure the file contains the desired final configuration for such markets!
This feature significantly simplifies creation of Custom Markets, saving you valuable time. Just upload your file, and your markets are ready to go!